Introduction/Overview
Middle school keyboarding is a 6th grade, Career and Technology
Education (CTE) course. It is the students’ first business
class. It is an 18 week semester course with goals focusing on
student improvement in technique, accuracy, and speed. In my
class, I focus heavily on projects which encompass a wide variety of
authentic problems (e. g. small business owner, advertisement writer,
magazine designer, graphics designer) for the students to
complete. I offer a total of 12 projects during the course
(business cards, resume, advertisements, business letters, and career
research, among others). This lesson plan is a subset of a unit
about “Careers.” It is tentatively designed to be 4-5
classes long with this lesson being 2 blocks.
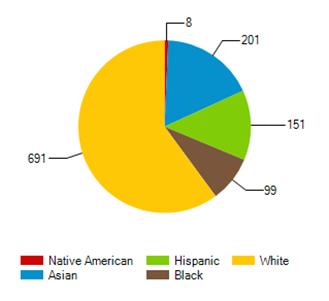
Macro demographics highlights of the school and county include:
Farmwell Station Middle school is a Loudoun County Public School of
roughly 1300 students, include 478 6th graders. The demographic
data is broken out in the following charts.
For 2012, additional Farmwell student profiles can be found here.
|
Did
Not Complete High School
|
4.81%
|
|
|
|
Completed
High School
|
16.03%
|
|
|
|
Some
College
|
18.71%
|
|
|
|
Completed
Associate Degree
|
7.47%
|
|
|
|
Completed
Bachelors Degree
|
35.73%
|
|
|
|
Completed
Graduate Degree
|
17.25%
|
|
|
Parental educational levels are also
extremely diverse and wide ranging. From census bureau data
summary, Farmwell parents have a broad range of backgrounds with a
predominance (over 59%) having a Bachelors or Graduate degree.
The national average is 10% lower for these degrees. For
additional census information can be found here.
Other data areas of note on the population of Loudoun County, as a
whole, include:
1) It is the fastest growing county in the
country over the past 10 years; 2) It has consistently been
one of the most affluent counties in the United States, earning the
“richest county in the United States” several years running
with an average household income of $119,000 (2012); 3) the Median
price for homes is $525K, one of the highest in Virginia and in the top
10 for the country.
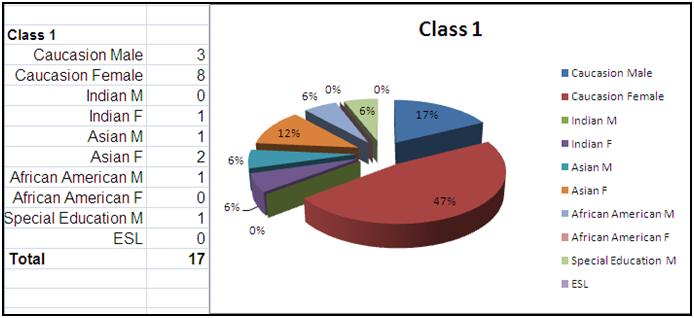
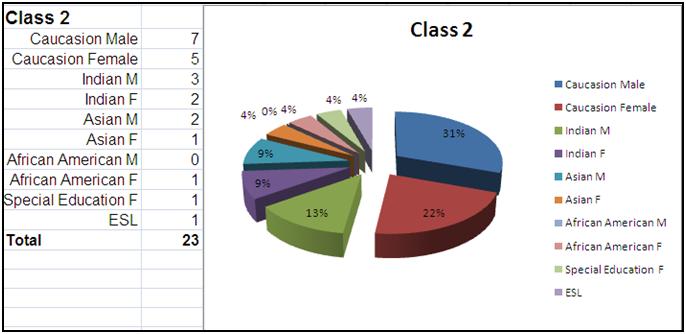
Micro Demographics—for purposes of this lesson practicum, each
will stratify the specific or micro breakdown of each class for
analysis, categories of race, general education, special education and
English as a Second Language or (ESL) data points:
As the following graphics illustrate, both classes are racially diverse
and cover the spectrum. These two classes are high performers.
Out of my 7 blocks, they have the highest and second highest class
averages with their keyboarding grades of 92% and 91% for classes 1 and
2, respectively.
Lesson Goals
From a broad perspective, the lesson goals for the lesson under study
are to help students think about what future careers they might be
interested in. We will have profiled several careers in class
including a lesson on career clusters (13 broad categories) as well
as worked on a resume and why they are important tools in helping
find work. The instructional goals include: 1) student
aptitude/interests; 2) skills; 3) research careers; 4) present
findings; 5) “best fit” career. I want the students
to learn: 1) Self discovery of personal traits/skills; 2)
research; 3) compare and contrast; 4) math and money; 5) presentation
6) career interests; 7) DEAPR and C-RAP. For a detailed
description of the lesson plan that this practicum represents, click
here: Lesson Plan. For details
of the rubric used to grade this plan, click here: Rubric.
In addition, my overt goals in teaching this lesson plan are as
follows: 1) I hope to have students develop an understanding for
careers, career fit, research and the thought process behind it; 2) I
want to convey that picking a career involves learning your interest,
skills, salary levels, and educational experience. All combine
into the process of discovering a career that would be a “best
fit” for the learners in this age group; 3), I also want them to
know that as they grow, their interest of choice may change as
well—and that is OK. Most 6th graders’ interests, as
they mature, change and evolve as well. They gain a greater
understanding of what they enjoy, what they are good at, as well as
various other dynamics that reflect student growth and change. That is
perfectly fine.
From the students’ perspective, they will hopefully be
learning several covert or hidden goals such as: learning
note taking skills, interest discovery, Internet searching/researching,
test, comparison/contrast, presentation skills (speaking, design
concepts, DEAPR and CRAP). The students have been exposed to
ACTS, SSCC, DEAPR, CRAP concepts throughout the quarter and their
importance in the class from previous lessons and from the review
process for this project. I am checking and reinforcing
students’ understanding of these concepts. I will also be
learning to provide timely and accurate feedback to students. I
hope to manage class processes forward towards the end
product—the presentation, which captures the rubric
information. I am checking and reinforcing my understanding
of SSCC, ACTS, CRAP and DEAPR. I am also learning to
facilitate discussions on each of the student’s presentations and
their motivations for their career selection as well as for
completeness.
Instructional goals for students include listening, following
directions and completing the various sections of the project
description. For my learning, ACTS, SSCC, CRAP and DEAPR are all
being integrated in this particular project. I will be
curious to see if I can incorporate and teach these concepts but this
is a culminating project and the concepts have each been covered
individually. The expected outcomes are for the students to produce a 5
page PowerPoint supported by data on careers. The
challenges are many—not all students are used to taking skills
inventories online or know what they want to do. Many are not
used to taking notes electronically (copy and paste, writing notations
as they go). In the past, it has been difficult to keep students
on track to complete the tasks sequentially. Many want to produce
the end product first. Some students get frustrated that the
tests they do online do not produce any “recommended cluster
area” andso they think that they are not suited for ANY career
(i. e. the test does not produce any recommendations for
careers). I guide them to the other sites that are more general
and will yield some results to help the students.
I will know student learning from several areas, per the practicum set
up. Quantitative and qualitative parameters will be used.
For this project, the rubric will be used to assess their PowerPoint
presentation (see previous link). From an instructional point of
view, I will be scaffolding additional content, background information,
presentations from classes, and previous project experience to
determine summative and formative assessments. From a tools
perspective, I will be using verbal feedback, quizzes, qualitative
(feedback and questioning for understanding, classroom discussion,
journal entry—career, what interests you), and
quantitative. I will also be keeping a teacher journal to capture
notes to indicate my impact on student learning. Lastly, I will
ask them if they found this project helpful in learning what they are
good at and if this career is something that interested them.
Quantitative (numeric) Evidence
of Student Learning
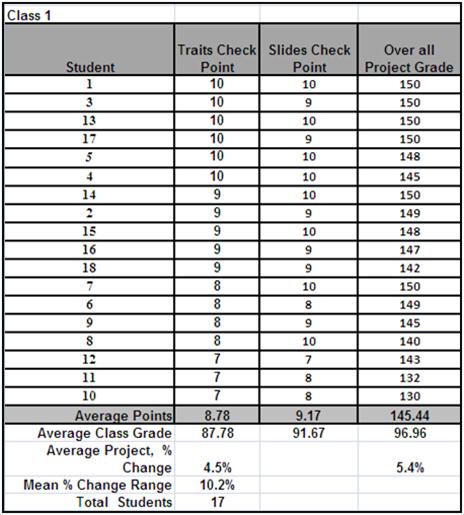 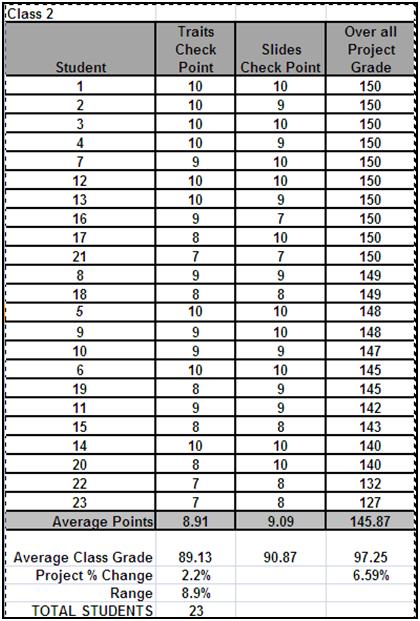
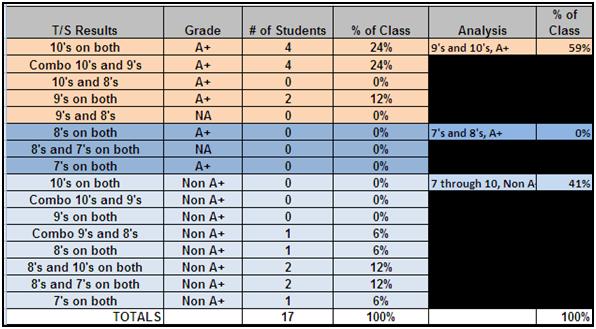
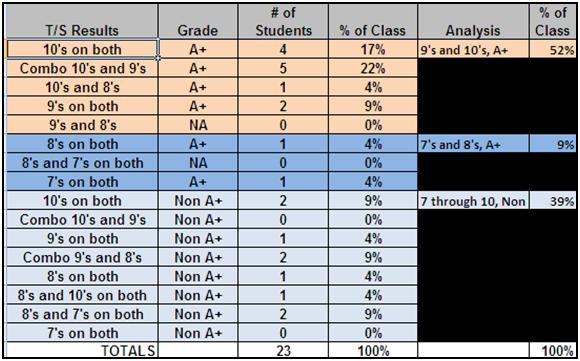
Class highlights from the data tables above
demonstrate many examples of learning. First, each class got
progressively got higher marks as each sequential check point was
recorded.
Second, the average class grade for both was 97%, which is a solid/high
A on the LCPS grading scale. One would expect to see more of a
bell curve in the data and not so skewed to the higher end A.
Third, the “Mean % Change range (a reflection of percentage
change between high and low data points)” of 10.2 % and 8.9%
improvement for classes 1 and 2, respectively. This can be
an indicator from a quantitative standpoint. However, there is no basis
to judge if these numbers are significant. It does show that
there were improvements in the scores as the classes moved forward with
the project phases. As such, this indicates a trend towards
understanding and thus learning improvement.
Fourth, the average class grade increased for each level with both
classes going from B-/B, to B+/A-, and then, in the final presentation,
yielding an extremely high A/A+ overall marks on the final
project. Since this data point is two grades above average and
also above the average class grades, it would suggest learning
improvement
Fifth, per the colored data, again for both classes, those students
that got 8’s and higher on their check points had a higher
probability of getting an A+. Those who got lower scores,
7’s and lower, tended to have lower grades on the project.
In summary, the data from both classes suggest that the most
significant demonstration of learning from this particular
practicum. Here, the colored data charts of each class
demonstrates that there is a positive correlation/relationship
between higher check point grades that students achieved and higher
academic performance on the project as a whole.
A positive relationship is here: the higher the initial check points,
the higher the overall project grade. The lower the check points,
the lower the overall project grade. For additional data sorting,
please go here: Spreadsheet.
The last point includes the Class Exit Survey: Was this beneficial?
Class 1: 88%; Class 2: 91% Did you learn something about a future
career?: Class 1: 83%; Class 2: 96%. Most (80%) enjoyed the
research and personality tests and discovered something knew about
themselves.
Qualitative Evidence of Student
Learning
The teacher journal entries/notes
yielded a wealth of information that show learning. For example,
through peer to peer or student to instructor conversation, there would
be a nod or phrase of “ahh, now I get it” or “that
makes more sense” as the project went on. Also, the
students tended to ask progressively more advanced/intelligent
questions as well. Along this “question thread,”
there were fewer questions for both the instructor and student project
managers. Learning was reflected in the quality of the projects
in that they matched the rubric requirements. Hence,
students were learning to follow the directions. In my class, I
have students call me over to do a cursory review. Here, there
were a lower number of student “redo’s.” Upon
reviewing work, could be quantitative but no data points were
collected. It was noted that students seemed to meet the rubric
requirements in fewer iterations/review sessions to get the project to
conform to Rubric. Some were as high as three, but others had it
right the first time.
Samples of Student Work
I tried to select a representative sample of student work across the
demographic. From my learning, I can say that a
“standard” rubric allows students to be flexible and
produce a wide variety of work with varying degrees of success on the
CRAP and DEAPR concepts. My learning process here is
notable. I should be more specific and break this project up into
components better. I totally did not model, coach and fade
more. I did not complete an example with the class nor in the
project description. I will note these more in the changes
I have included 3 student samples for review and comment. First,
the Thetga example is notable
because of the common theme amongst the slides that exemplify the
design concepts. It is visually appealing, and the information
content is very well done. The Thalbaum example is just the
opposite—no theme across the slides but it does adhere to the
concept on a slide by slide basis and still meets the criteria.
The data collected is good but it, in my opinion, is not as visually
appealing. The last one I selected for review is the special
education student. Voutrebeck
is one to note in that she needed more time and would have benefited
from a “subset” approach of 1-2 slides with a preselected
group of traits. Copying, pasting and overall design concepts
were difficult for this student. That said, she was learning and
making progress. Each time she was checked on, more information
and data were in the slides/notes section of the project. Her
progress was slow but still on the mark.
What Worked
Notes from the teacher journal again offered plenty of discussion
points. First, the structure and content of the lesson plan and project description did help
guide many students. Off loading saved a great deal of
time. It freed me up to help with other difficulties that
students were having. It made the classroom management efforts
easier. The career
clusters traits were helpful in offering guidance and starting off
points for students not sure of test results or needed help getting a
general idea of what they might be good at. Additionally, the
presentation that the Guidance Councilors did helped in scaffolding of
traits, importance of careers and the career cluster categories, and
reinforced student understanding. Also, it offloads more career
information from another source (i. e. not just one teacher but another
individual) offered reinforcement of the concepts to the student.
The student project managers—helpers--did a great job in
assisting others. Peer to peer assistance really is a great way
for students to learn. This offloading also makes classroom
management smoother and more rapid. Just a final point on the
student helpers, when I would explain a process to a student and check
for understanding, they would say “yes, I get it.” As
I would leave and they would ask a neighbor the same question they
asked me, the peer would repeat the same solution but the student would
process better with these directions and perform the task flawlessly.
What Would I Change/Modify
Highlights from the teacher journal from both classes yield some
interesting information. I alluded to it earlier that there was
no “exit strategy” for those that are ESL or Sped. In
the future, I will have a reduce work/subset rubric which will simplify
the project description and product outcomes. In addition, the
amount of time was grossly under estimated. This project could
easily take 3-4 class blocks if I teach this as a culminating classroom
activity. I am very disappointed in myself that my standard
method of teaching “model, coach, fade” was not more fully
utilized. This, I am sure, caused more confusion and frustration
to students. I would also increase scaffolding concepts with more
“mini projects” that will lead up to a larger, more
comprehensive one that will be the final deliverable. This should
help build student confidence and not have them feel overwhelmed.
While the test sites are a good resource, I would cut down on the
number of test sites. I would try to find sites that are more age
appropriate with traits or get a list for the students with some
simplified traits. This project is designed to be a second
quarter (more experience under their belts, better act directions,
copy/cut/paste/searching). It will be going back to that place in
the pacing guide.
It should be noted that this is the first time that I have executed a
lesson plan with the whole class. I have done other activities as
a class but the pacing is normally done by individual student paced
progress and a per student basis (i. e. every 4 lessons students do a
project). This keeps the number of students in class doing
projects to 5-7 Tops. With this approach, it is much easier for
me to manage, ease frustration for students for wait time, and relieve
some classroom management difficulties. I prefer more detailed
one on one more times. With 18 and 23 students doing this, it was
difficult. Two or three student managers were also overwhelmed at
times.
Lessons for Your Practice
From the beginning of the ITS program, we have been taught to use
tools/techniques that provide the most affordance—which I have
used time and time again. Authentic
Problems from AeCTS
being the most beneficial, I have redone all of my 12 projects to
reflect this. I have developed a keyboarding review
“game” to mimic play and video games. Other areas
have been of huge value added to me as a designer, and my students have
reaped so many rewards.
As far as reflecting on this experience, I must say this practicum
process left me with very mixed emotions and feelings. I am
reminded of a very famous Charles Dickens quote from A Tale of Two
Cities, “It was the best of times. It was the worst of
times.” For this practicum, it was more bad than good with
some ugly thrown in to boot. I would also point out that you get
out of it what you put into it so I take a huge part of the
blame. It is all a process of improvement and that is a very big
“learn” on my part. So here we go, the best and the
worst.
“The best of times..”
First and foremost, this reconfirmed my
decision to be a teacher. I enjoy teaching. With this
practicum process, I am reminded of one of my favorite teacher quotes
from Socrates: “I cannot teach anybody any thing, I can only make
them think.” In implementing a new lesson/project, it was a
great experience, albeit at times chaotic, to have student interaction,
questions—good and bad, the exchange of ideas and information,
the look of joy, puzzlement and wonder—all good. I still
have an incredibly long way to go but a solid foundation that will get
better with ITS guidance, affordances (a FACTS
component), and delivery refinement. Second, I am a huge process
improvement fanatic on several levels. After 16 years in
sales, the last 3 being involved with change and configuration
management, it is all about the process. See something that
works, use it. Lesson refinement, goals, and delivery will be changed
for this lesson plan in the future. This reinforces
constant evaluation and my notion that nothing should be wasted in
class. Everything should have a purpose which I have tried to
model. The teaching journal is a great tool. In the past, I
have taken mental notes. Here, I can take summary notes,
feelings, and type them in for later review. I really enjoy the
process improvement that the journal affords. Go back and do more
of what worked, less of what did not or figure out how to make it work
better. Lastly, this experience reinforced ITS knowledge. In
particular, Vygotsky and Pink were the biggest “value adds”
to my tool bag and were employed here. First, Vygotsky’s “Model,
Coach, Fade” is a wondrous concept that I have used for
years—albeit inconsistently as was noted in the practicum
improvements. When I do it, the students really work with greater
understanding For my second practicum, I am going to have
one class do the project from the description with a generic overview
and the other class I will “model, coach, fade” and see
which class learns better Second, Pinks’ A Whole New Mind
concept of MOPEDS
will be actively brought into and further cultivated in my classroom
activities, lesson plans, and projects.
“The worst of
times…”
I am a
numbers person—trends, probabilities, and percentages. I
love numbers from a business perspective. I understand their
value in analysis but feel that it was overkill at this level.
Probably my own “undoing” in what I was trying to
prove. I would probably not do this for every project (I have 12)
in order to objectively prove that learning takes place. As such,
the affordances of this part were low to me as a designer and will
probably not make its way into my tool bag. Second, I do not enjoy
numbers to validate that learning takes place at this level. Get
enough through anecdotal evidence—a nod, a verbal phrase, and
then to see them react correctly on the computer is enough in some
cases. Quantitative--while valid to prove some learning--seems to
be overkill in this practicum, for me. Sometimes it is not about
the numbers but about students enjoying the activity/project/learning
experience. I can see that I probably brought this on myself with
what I saw was a trend and how to capture and illustrate it.
Third, teaching in larger groups is a challenge for me, one I will
master. I thought I had the knowledge base and experience to work
in any environment—large or small. That said, individual or
small group instruction, from my teaching style and perspective, are
preferred. For me, it provides better focus and concentration for
teacher and learner. Individual attention for longer periods of
engagement suites the students’ needs more and shows that the
teacher is caring, understanding, and can be effective at adding
understanding.
More general criticisms are from a “value add” perspective
to my teaching style and content, not very high with this practicum
process. I also accept responsibility in trying to offload too
much on the project description - too much reliance on this proved to
be more confusing for some. I did not perform my “model,
coach, fade” well at all. In addition, practicum by
definition means: “A school or college course, especially
one in a specialized field of study that is designed to give students
supervised practical application of previously studied
theory.” It is impractical to expect direct supervision in
this type of course, but this is what drives me.
Feedback--immediate and constructive—both from business and
education perspective are just the best. I thrive on that!.
In a perfect world--which does require a great deal of work, I would
have like to have scheduled times to observe - 30 minutes or so of each
cohort. I realize this is unrealistic given the timeframe,
schedules, and constraints of the people involved. It feels, to
me, like it is not enough information to refine or improve the process
adequately--for myself or my students--to gain benefit. I take
blame in that I should be proactive in sharing notes, feelings, and
ideas on a more “real time basis.” With this process,
it was a self evaluation—while beneficial, I believe that more
can be gained from sage experts providing feedback after seeing a
cohort “in action.”
That said, this exercise process was a mix of good and bad for my
designer tool bag of
knowledge. I have another one to put
together and will change the process and improve. Again, these
are my feelings and reflections which I have always written from the
heart. In life, you learn a lot of what to do and a great deal
more of what NOT to do, but that is learning and it moves the process
forward.
|

