|
|
George Mason UniversityZakaria Tarik ZerhouniSource: Home > Project 3 > Step 1Math 447: Numerical Analysis
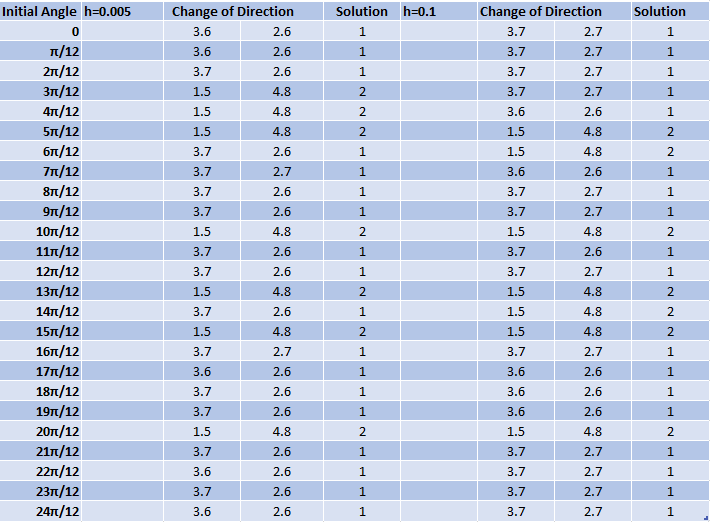
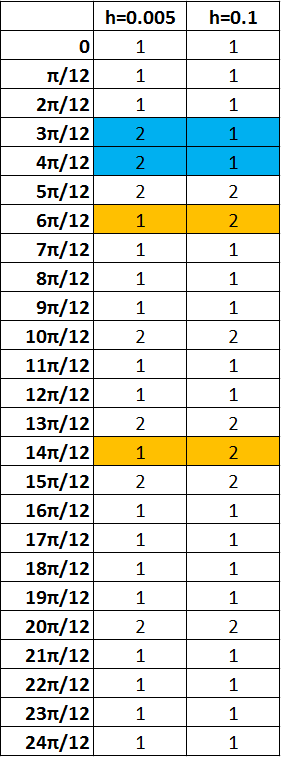
The objective of Computer Problem 6.3.4 requires the construction of a forced, damped pendulum. The damping opposes the direction of the velocity proportionally and represents phenomena such as friction and air resistance. The forcing function provides time dependent input which under the right conditions can produce chaotic motion. The system of differential equations modeling the forced, damped pendulum is, \( \displaystyle y_1' = y_2 \), \( \displaystyle y_2' = - \frac{g}{l} \sin y_1 - dy_2 + A \sin t \). We were first asked to investigate the behaviour of the forced, damped pendulum setting the damping coefficient as \( d = 1 \) and the forcing parameter as \(A = 10 \). While setting the step size to \( h = 0.005 \), we were to find "attracting" periodic trajectories and then compare the outcomes obtained using a step size of \( h = 0.005 \) to a larger step size of \( h = 0.1 \). What was found was that there are two "solutions" for both step sizes which any given set of initial conditions can be attracted to. In the following videos we will show these two solutions. Solution 1Click here to see the code used to generate these animations. Click here to download the video. Solution 2Click here to see the code used to generate these animations. Click here to download the video. Solution 1 reverses directions at two points which are approximating \( y = \{2.65, 3.65\} \). Solution 2 reverses directions at approximately \( y = \{1.45, 4.8\} \). Table 1.1 below determines by the angle at which the velocity changes direction which trajectory was being followed. This was accomplished by calculating the position for 12000 steps when \(h = 0.005\) and for 600 steps when \(h = 0.1\). The initial angles were changed while the initial velocity was always kept as zero. After observing that the directional change alternated, the final two positions of direction change were used to determine which solution had been achieved. Table 1.1  Click on the table to view the associated code. What is of interest can be seen from Table 1.2 where the solutions are reversed when the step sizes are different. Table 1.2  Click on the table to view the associated code. In order to explain why the solutions have alternated in our pendulum simulation, Figure 1.1 is provided below. On the slope field seen, if a starting position is in a given region of the field, it will be drawn into the solution associated with that region. When the step size is larger, there is a chance that a computation will jump from one region to another and be drawn into the incorrect solution due to the computational error. Figure 1.1 
|