Overview
* Configured handsets, transmitters, power supplies and receivers to take communication recordings.
* Transmitted signals via USRP and recorded the signals with an MMS receiver.
* Analyzed the communication recordings for baud rate, bandwidth, hop duration, hop period, frame sync, and hop frequencies.
* Created table (Identification) files for the different handset/receivers to enable detection using FAST software tool.
* Performed statistical analysis on the probability of detection of USRP signal transmissions
* Observed the effects of the different SNR’s on the number of output frames and bit error rate (BER).
* Computing and programming done with Redhat Linux, XMidas DSP software, and python.
* Communication and DSP Theory:  SNR, mixing, tuning, filtering, decimating, sampling theory, modulation.
Summary
During the summer of 2015, I had the privilege of holding the postion of Digital Communications Engineering Intern with Bit Systems, in Sterling, Virginia. The main focus of my internship was to take a communication signal, degrade it to different levels of SNR, and then perform statistical analysis on the probability of detection of theses signals. Here is a block diagram that outlines the basic approach:
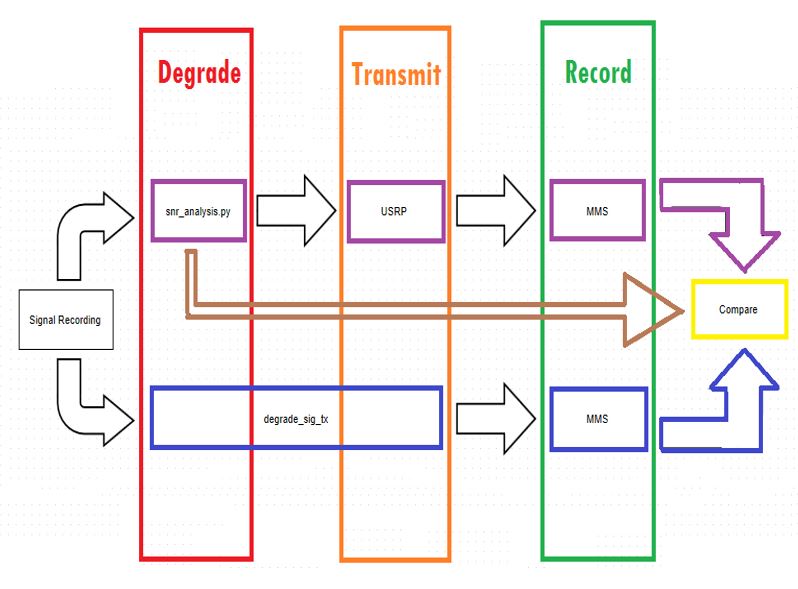
The blue route represents the statistically relevant testing path. In this path the 10 second snapshot of the original signal was transmitted continuously for a given amount of time, while statistically relevant AWGN was added during the transmission via USRP. Once again the transmission was tested for detections, recorded, and analyzed.
The difference in the two routes is that the purple path transmits the same degraded signal repeatedly (statistically irrelevant), the blue route transmits the original signal while continuously overlaying AWGN (statistically relevant).
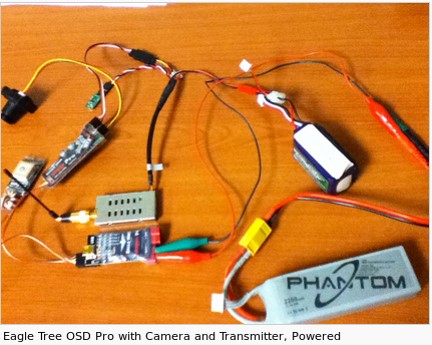
BITS had recordings of handset/receiver pairs before I started my internship, but as the summer progressed I configured hardware to take additional pure recordings. The picture below shows the hardware setup of a camera being attached to a GPS, processor, power source, and transmitter: