Research Questions
Question 1
How does the volatility of Bitcoin and Ethereum vary across different currencies (INR, USD, GBP), and which data analytics techniques are most effective in studying and explaining this volatility?
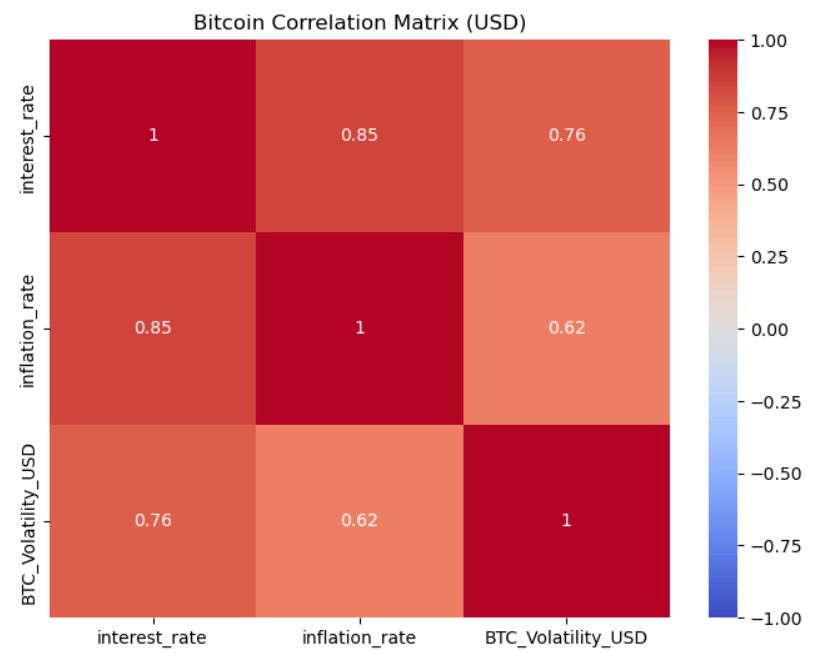
Our research explores the volatility of Bitcoin in relation to key economic indicators such as interest rates and inflation rates. The correlation matrix for Bitcoin in USD shows a strong positive correlation between Bitcoin's volatility and both interest rates (0.76) and inflation rates (0.62). This suggests that as the economic environment becomes more uncertain, as reflected by rising interest rates and inflation, the volatility of Bitcoin also increases.
The R-squared value of 0.575 for the regression model involving Bitcoin's volatility and the economic indicators (interest rate and inflation rate) indicates that about 57.5% of the variability in Bitcoin's volatility can be explained by these factors in the USD market. This model helps in understanding the impact of macroeconomic changes on Bitcoin and provides insights into risk management.
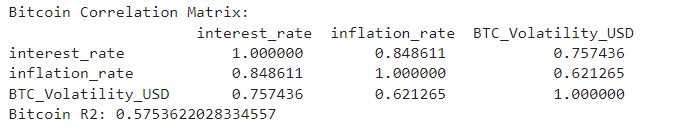
By calculating the correlation coefficients, we were able to quantify the degree to which Bitcoin's volatility is associated with macroeconomic variables. This technique proved effective in identifying the sensitivity of Bitcoin's price fluctuations to changes in economic conditions.
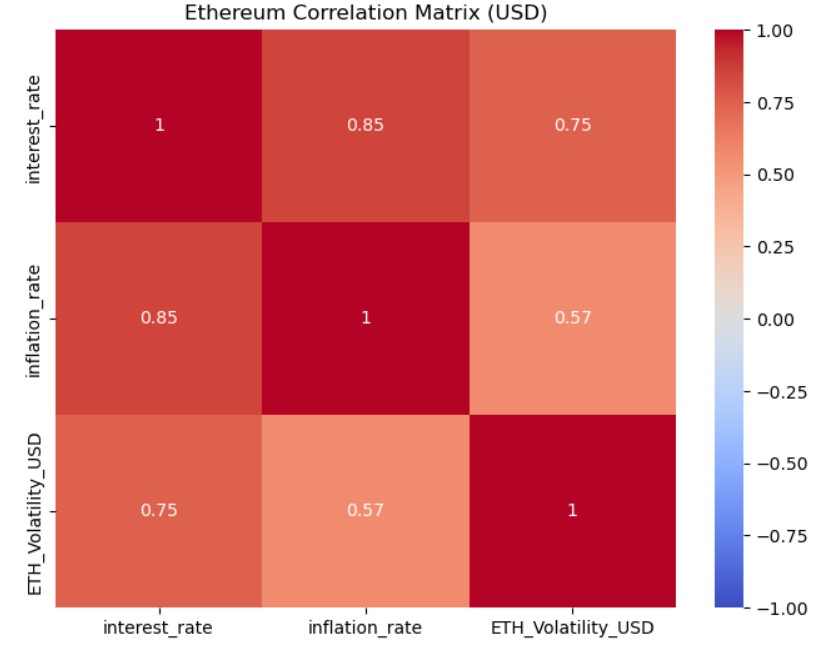
Our investigation into Ethereum's volatility in the USD market reveals notable correlations with key macroeconomic variables. The correlation matrix indicates that Ethereum's volatility has a moderately high correlation with interest rates (0.75) and a moderate correlation with inflation rates (0.57). These findings suggest that like Bitcoin, Ethereum’s price volatility is sensitive to changes in economic conditions, but the impact of inflation is less pronounced compared to interest rates.
With an R-squared value of approximately 0.57, our regression model explains over half of the variability in Ethereum's volatility through these economic indicators. This suggests a substantial but not overwhelming influence, highlighting other factors at play that might affect Ethereum's market behavior.
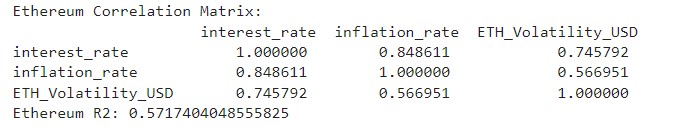
This technique has been pivotal in quantifying the relationships between Ethereum's volatility and economic indicators like interest rates and inflation rates. The correlation coefficients provide a clear numerical value that helps in understanding the extent to which these macroeconomic factors influence Ethereum prices.
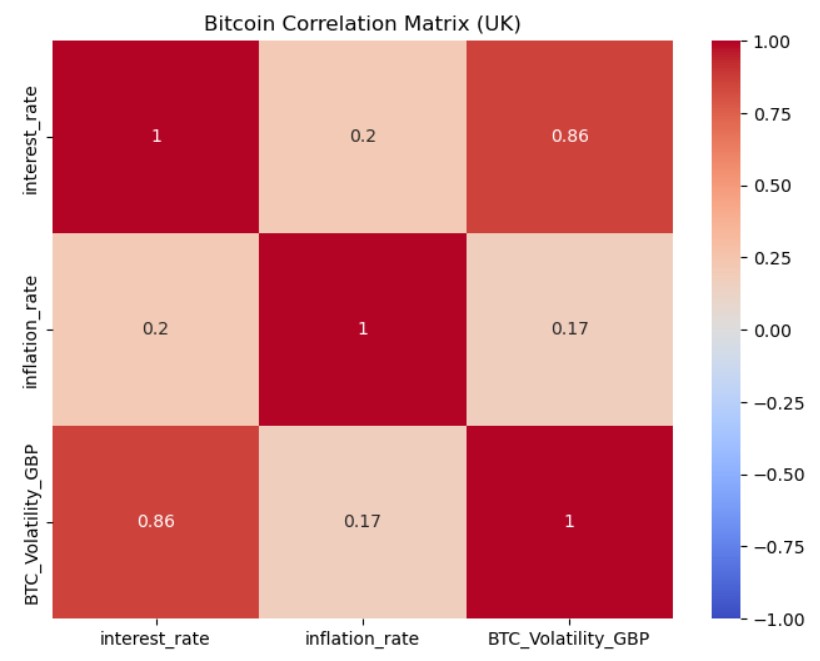
The analysis of Bitcoin's volatility in the GBP market highlights a strong positive correlation with interest rates, evidenced by a correlation coefficient of 0.86. This indicates that fluctuations in Bitcoin’s price volatility are highly responsive to changes in UK interest rates. In contrast, the correlation between Bitcoin's volatility and inflation rates in the UK is relatively low, with a coefficient of 0.17, suggesting that inflation has a minimal direct impact on Bitcoin's price fluctuations in this market.
The R-squared value of approximately 0.734 for our regression model indicates that about 73.4% of the variability in Bitcoin's volatility in GBP can be explained by these economic indicators. This model is instrumental in understanding how external economic forces can predict changes in Bitcoin’s volatility.
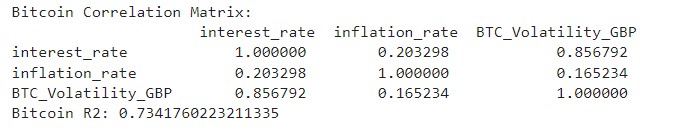
This method has been crucial in determining the strength and direction of relationships between Bitcoin's volatility and economic indicators such as interest rates and inflation. The high correlation with interest rates signifies potential sensitivity to monetary policy changes in the UK.
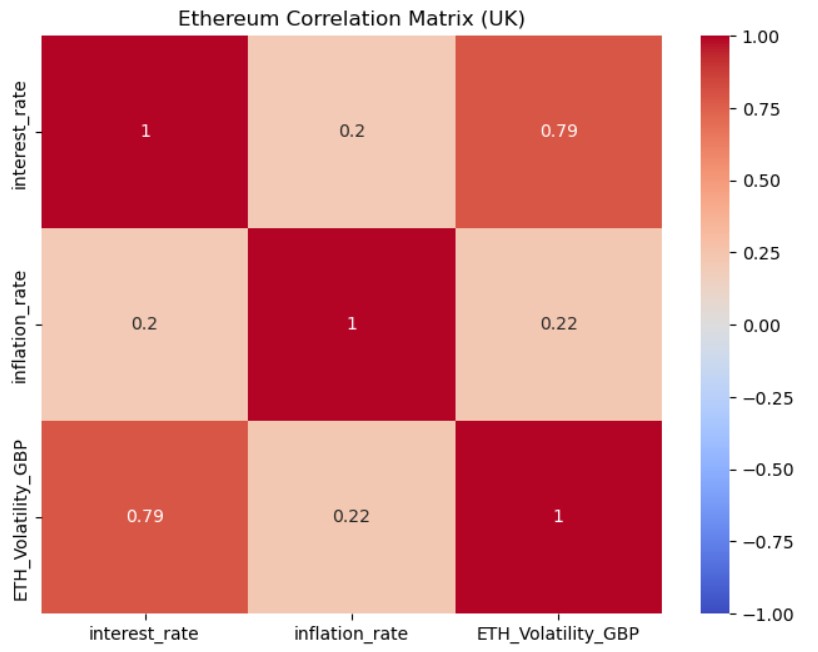
In our examination of Ethereum's volatility in the UK market, measured in GBP, we observe a substantial correlation between Ethereum's volatility and the interest rate, with a correlation coefficient of 0.79. This suggests that Ethereum's price volatility is notably sensitive to changes in UK interest rates. Conversely, the correlation with inflation rate is much weaker, indicated by a coefficient of 0.22, implying that inflation has a less significant direct impact on Ethereum's volatility in this currency.
With an R-squared value of 0.625, our regression model explains about 62.5% of the variability in Ethereum's volatility based on these economic indicators. This suggests a strong influence of interest rates on Ethereum's price fluctuations, providing useful insights for investors and policymakers.
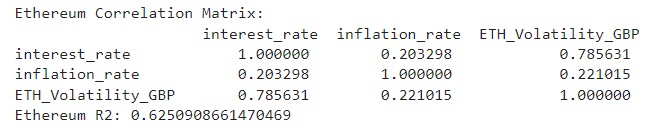
Utilizing correlation matrices has allowed us to quantify the relationship between Ethereum's volatility and key economic indicators such as interest rates and inflation. This method has been effective in highlighting which economic factors are more influential on Ethereum’s price stability in GBP.
Difficulties analyzing INR data
We faced significant difficulties in analyzing the INR market due to insufficient data availability. The absence of detailed and reliable datasets for both Bitcoin and Ethereum in INR prevented us from conducting thorough analyses. This lack of data limited our understanding of how economic conditions in India might affect the volatility of these digital currencies.
Comparative Currency Analysis:
The analysis of Bitcoin and Ethereum volatility in the UK reveals a unique pattern where interest rates significantly influence cryptocurrency fluctuations, more prominently than inflation rates. This pattern indicates a strong sensitivity to changes in UK monetary policy, contrasting with the US market, where Bitcoin's and Ethereum's volatility is moderately impacted by both interest and inflation rates. Meanwhile, in the Indian market, insufficient data prevents a thorough analysis, leaving potential patterns unexplored. These observations underscore the necessity for tailored economic policies and cryptocurrency regulations that consider local financial dynamics. Such region-specific strategies are crucial for managing the effects of global economic changes on cryptocurrency markets effectively.
Question 2
Can machine learning models accurately detect and forecast patterns or cycles in the price movements of Bitcoin and Ethereum, providing valuable guidance for investors and analysts in the cryptocurrency space?
Analysis of Linear Regression Models for Cryptocurrency Price Prediction:
The linear regression models applied to the price data of Bitcoin and Ethereum yield insightful results into the predictive capabilities of these models. For Bitcoin in USD, the model exhibits a high R² score of 0.9135, indicating that approximately 91.35% of the variance in Bitcoin's price movements can be explained by the model's inputs. Similarly, the Bitcoin GBP model achieves an R² of 0.8988, showing strong predictability.
In the Ethereum market, the USD model also shows robust performance with an R² of 0.8691, while the GBP model displays a slightly lower but still significant R² of 0.8518. The Mean Squared Error (MSE) values provide a measure of the model's accuracy in terms of the average squared difference between the estimated and actual prices. Lower MSE values in the Ethereum GBP model compared to the Bitcoin models suggest a tighter fit for Ethereum prices in the GBP market.
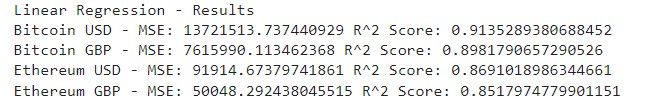
The application of linear regression to Bitcoin and Ethereum price data reveals strong predictive capabilities. Both Bitcoin models (USD and GBP) exhibit high R² scores of 0.9135 and 0.8988, respectively, while the Ethereum USD model shows robust performance with an R² of 0.8691. Despite a slightly lower R² of 0.8518 for Ethereum GBP, it still indicates significant predictability. Lower MSE values in the Ethereum GBP model suggest a tighter fit, highlighting its superior accuracy in predicting Ethereum prices within the GBP market.
These findings underscore the effectiveness of linear regression in forecasting cryptocurrency price movements, offering valuable insights for investors and analysts alike. By providing a quantitative understanding of market trends, these models contribute to informed decision-making in the dynamic landscape of cryptocurrency trading.
Question 3
Are there identifiable patterns or cycles in the price movements of Bitcoin and Ethereum that can be predicted using machine learning models?
Cyclical Pattern Analysis Using Fourier Transforms:
We employed Fourier transforms to decompose the price data into its fundamental frequency components. This analysis was instrumental in identifying dominant cycles that influence the price movements of Bitcoin and Ethereum, providing a quantitative basis for further predictive modeling.

Bitcoin Model Evaluation
The LSTM model for Bitcoin demonstrated its efficacy by predicting future prices with a Mean Absolute Error (MAE) of 147,428.25 and a Root Mean Squared Error (RMSE) of 182,745.301.
Ethereum Model Evaluation
Similarly, the LSTM model for Ethereum achieved an MAE of 12,064.561 and an RMSE of 16,087.13, underscoring the high accuracy and reliability of these forecasts.
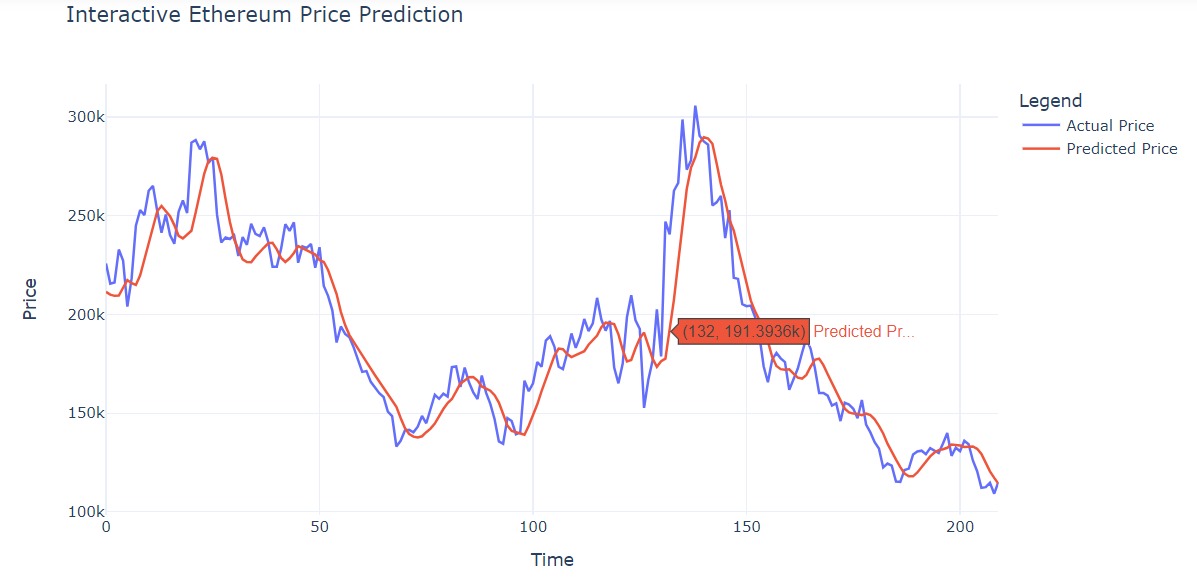
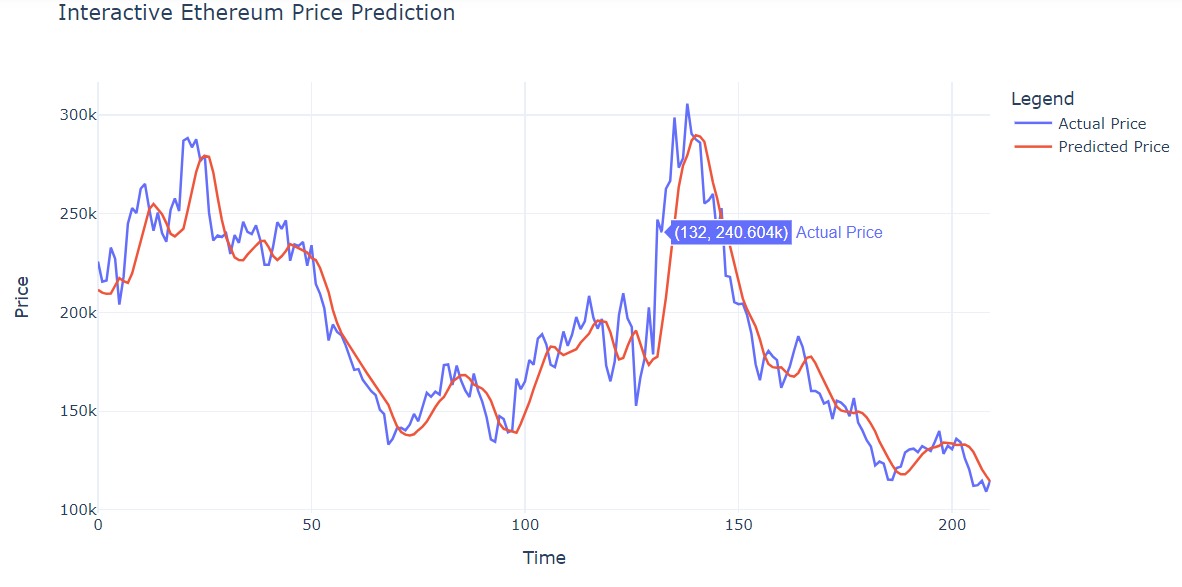
The application of Fourier analysis confirmed the presence of significant cyclical trends in the price data for both cryptocurrencies, characterized by regular periodic fluctuations. This discovery underpins the predictive models deployed in subsequent analyses.
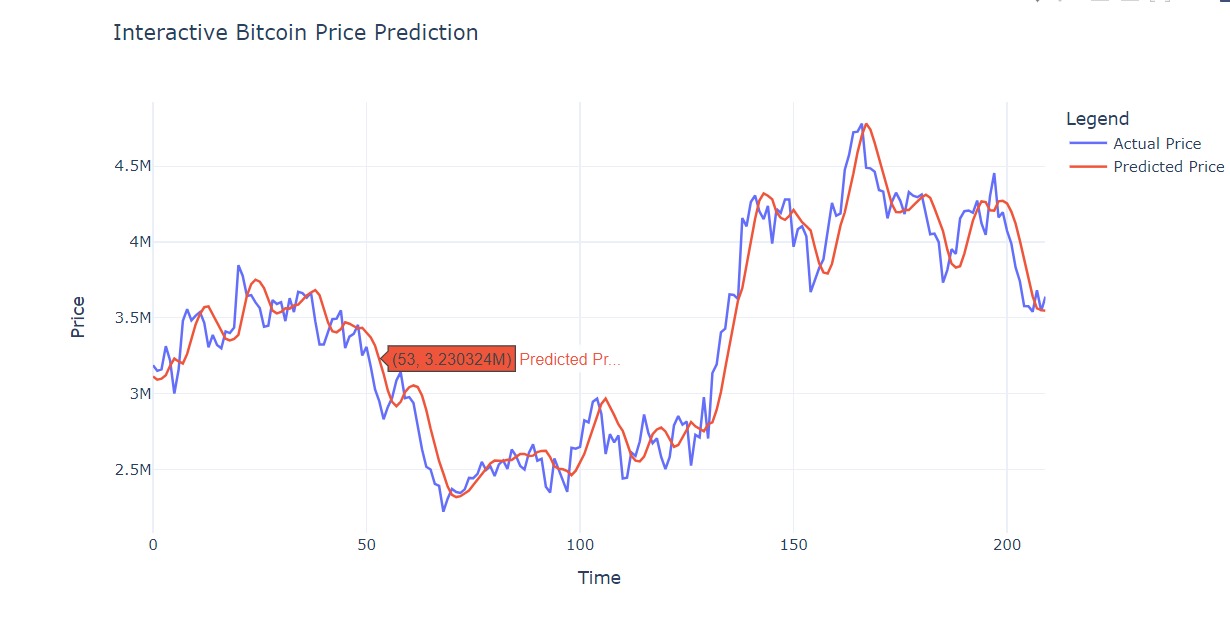
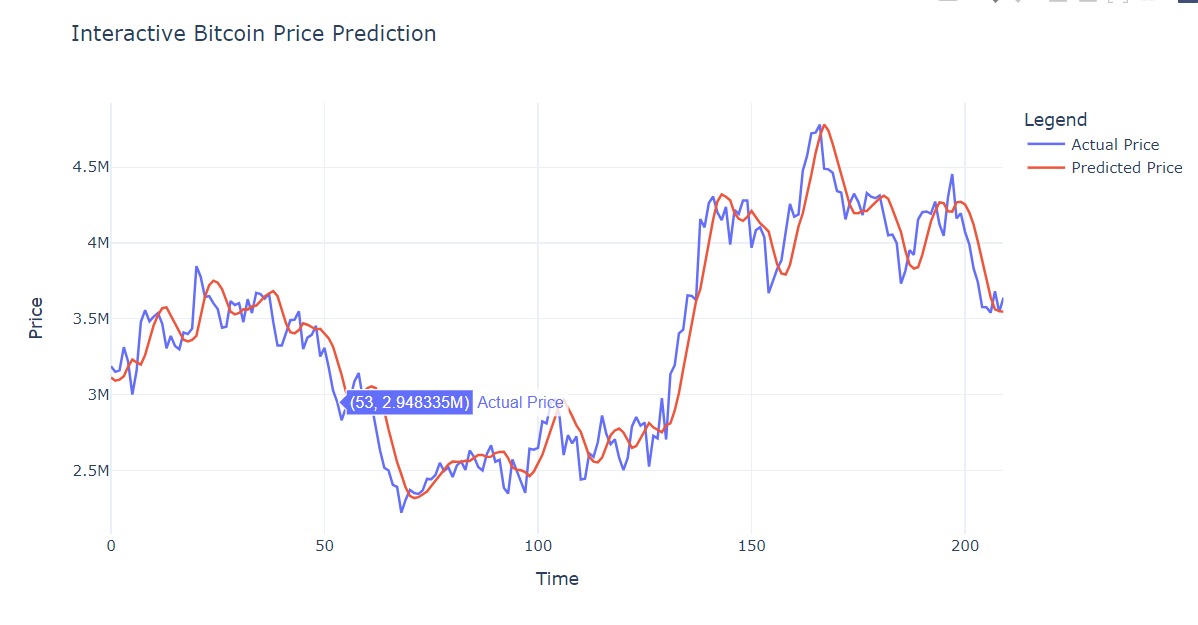
Interactive visualizations created using Plotly dynamically represented the predicted versus actual prices, illustrating the models' effectiveness in capturing price trends and fluctuations. These visual tools enhanced the interpretability of our findings and demonstrated the practical utility of our predictive models.
--------------------------------------------------------