Importing Data
Our study analyzed digital currency trends from 2021 to 2024, including CBDCs, Bitcoin, and Ethereum, across INR, USD, and GBP. We sourced reliable data, utilized Python Pandas for data preparation, and meticulously cleaned the datasets. Our thorough data cleaning process allowed us to explore the influence of digital currencies on the banking sector and their implications for global economic policies and stability, offering insights into the evolving landscape of the digital economy and central banking systems worldwide in a detailed, data-driven narrative.
Data Cleaning
During our project's data preparation phase, we executed a series of technical transformations on our cryptocurrency datasets. We parsed dates into ISO 8601 format, enabling temporal analyses, and converted numeric strings into floating-point representations for computational precision. Commas and percentage symbols, which impede numerical processing, were systematically stripped from the dataset. The 'Vol.' column's notations—'K' for thousands, 'M' for millions, and 'B' for billions—were expanded into actual numerical values to standardize the volume data. These technical refinements were critical to ensuring the accuracy of our subsequent quantitative analysis, offering a robust dataset for assessing the influence of digital currencies on economic trends.
Data Manipulation
Data manipulation was a pivotal step in the exploration of cryptocurrency markets for Bitcoin and Ethereum. We harmonized six datasets into two, encapsulating Bitcoin and Ethereum's trading figures across INR, USD, and GBP. Post-cleaning, we merged the currency-specific datasets to create unified datasets for each cryptocurrency, streamlining our analysis. This consolidation allowed us to effectively compare the cryptocurrencies’ performance in different economic conditions and facilitated a more integrated examination of their global impact, laying the groundwork for a comprehensive analysis of their influence on the financial ecosystem and central bank policies.
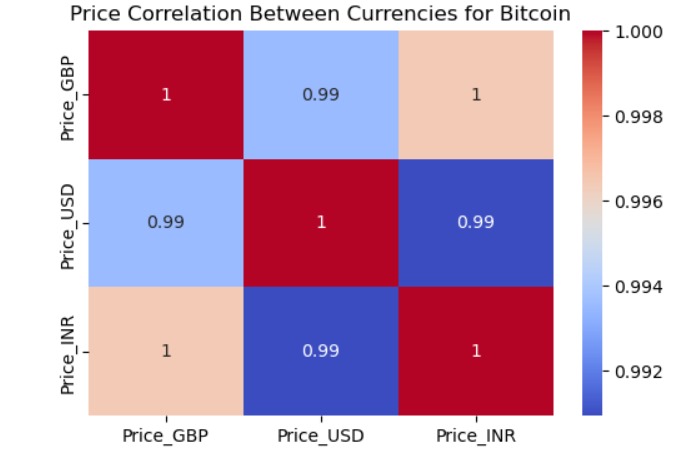
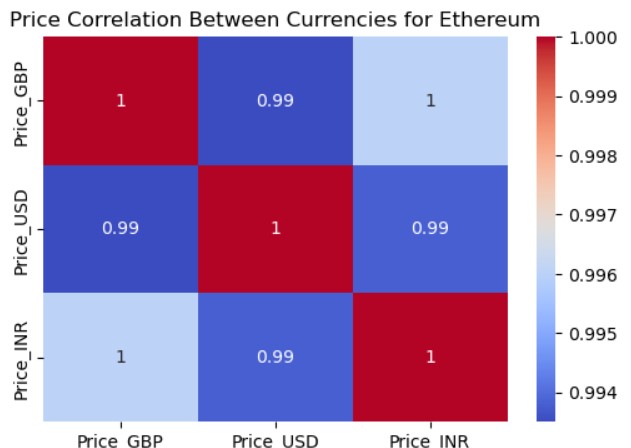
Correlation Matrix
The correlation matrix reveals Bitcoin and Ethereum's price movements are highly synchronized across GBP, USD, and INR, demonstrating a global market coherence beyond currency barriers. For Bitcoin, a near-perfect correlation coefficient around 0.99 suggests a global resonance to market shifts, affirming its widespread influence. Similarly, Ethereum exhibits strong price consistency across these currencies, with correlations close to 1, underscoring its global acceptance and investor synchronization. These findings highlight both cryptocurrencies' integrated market behavior, reflecting a unified response to economic stimuli worldwide, and affirming their roles as significant, globally-traded assets.
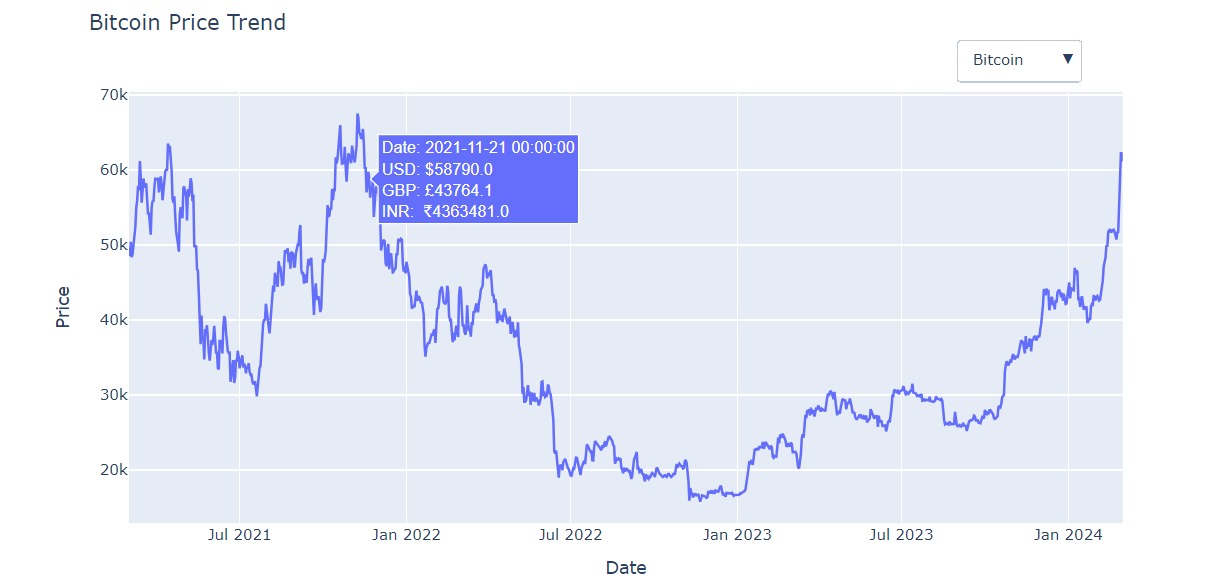
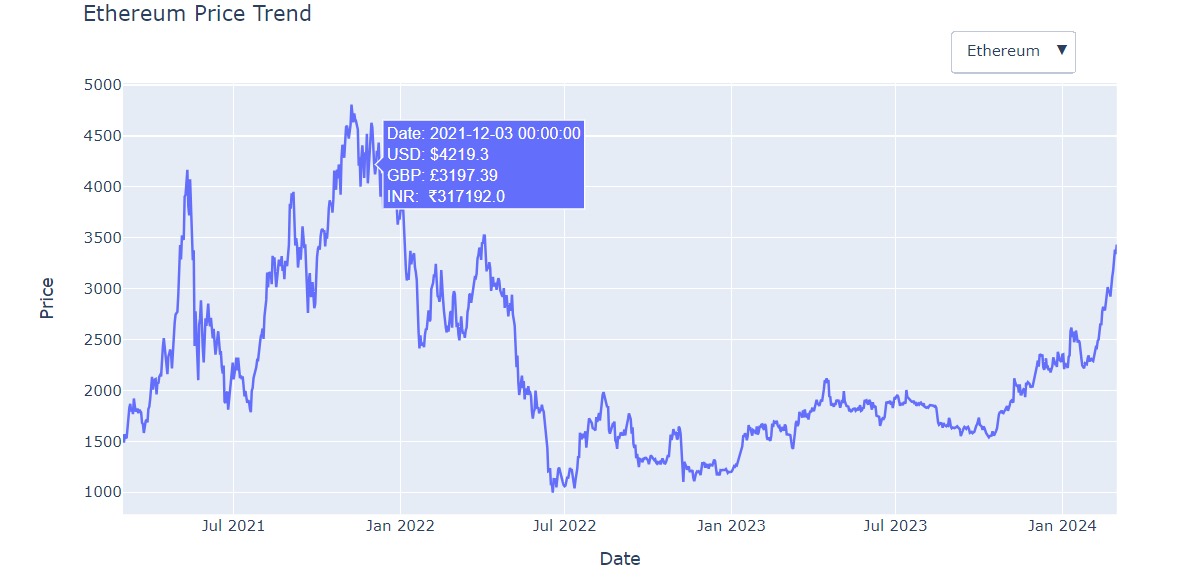
Trend Analysis
Analyzing Bitcoin and Ethereum from 2021 to 2024, our line graphs revealed Bitcoin's high volatility and Ethereum's gradual price increase, reflecting varying investor confidence. The marked fluctuations for Bitcoin contrasted with Ethereum’s more uniform growth, hinting at its emerging stability in the market. These trends not only highlighted daily trading patterns but also how global economic shifts impact these cryptocurrencies, with Bitcoin reacting swiftly to news and Ethereum showing steadier, trust-building growth. This analysis offered insights into the financial behaviors shaping the digital economy's future.
Volumn Analysis
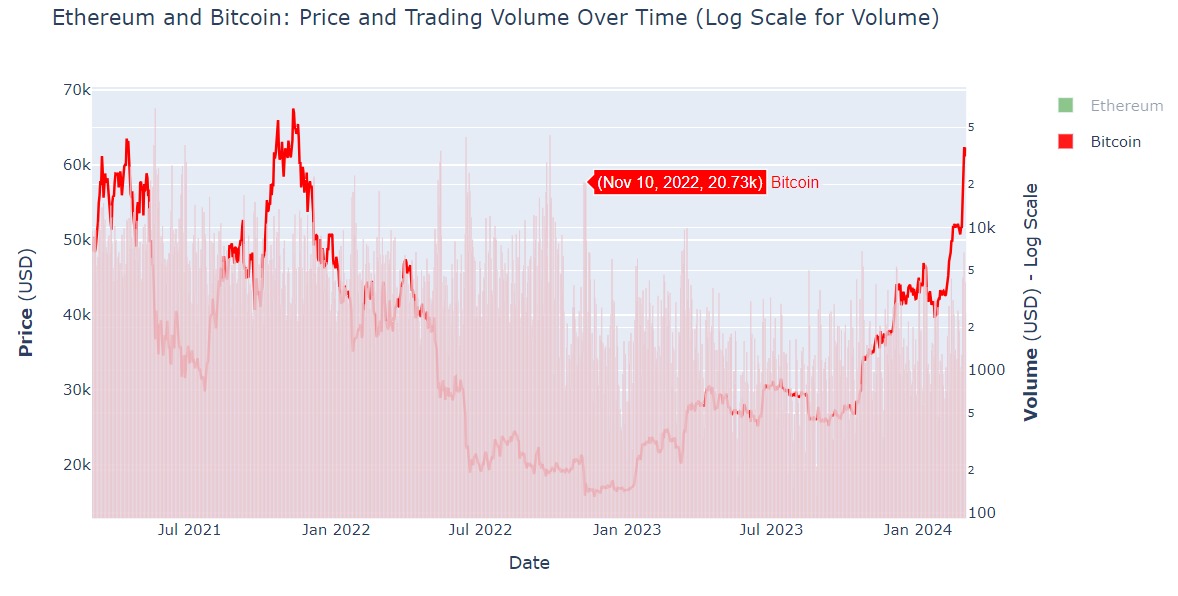
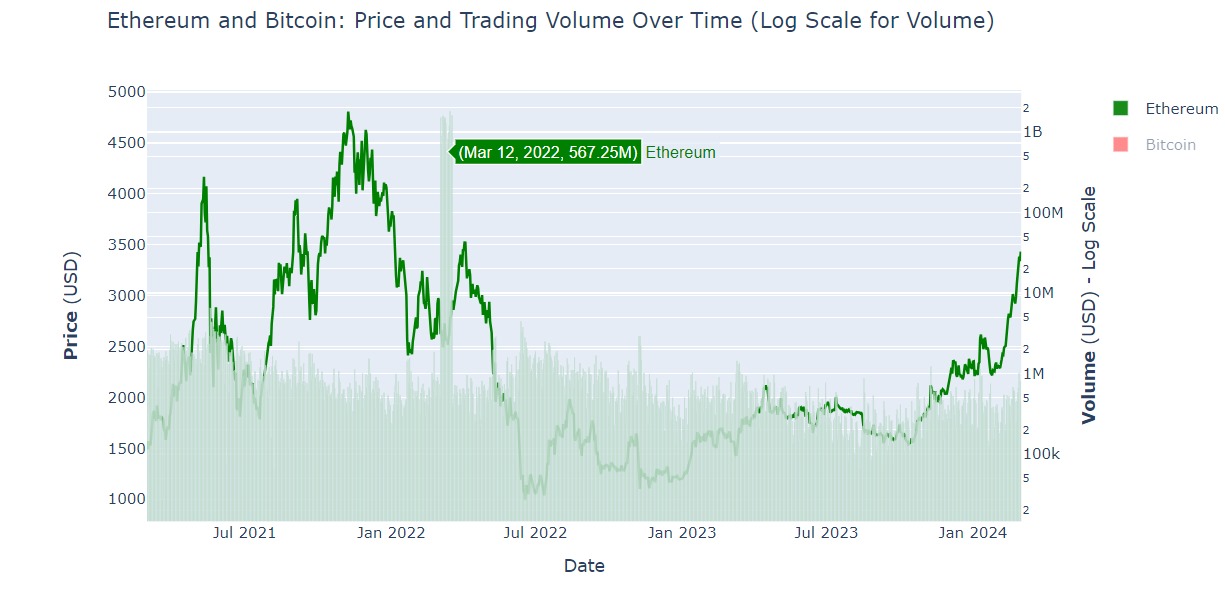
The graph provides a comparative analysis of Ethereum and Bitcoin's pricing and trading volumes from mid-2021 to early 2024, with Ethereum represented in green and Bitcoin in red. It skillfully overlays price trends with semi-transparent volume bars, employing a logarithmic scale to enhance visibility of volume changes, ensuring even the smallest fluctuations are noted. This period highlights significant market reactions, with price peaks and volume surges reflecting shifts in news or investor sentiment. An essential tool for financial analysis, this visualization aids in deciphering the complex relationship between market behavior and cryptocurrency valuations, offering deep insights for informed trading strategies.
Candlestick Analysis
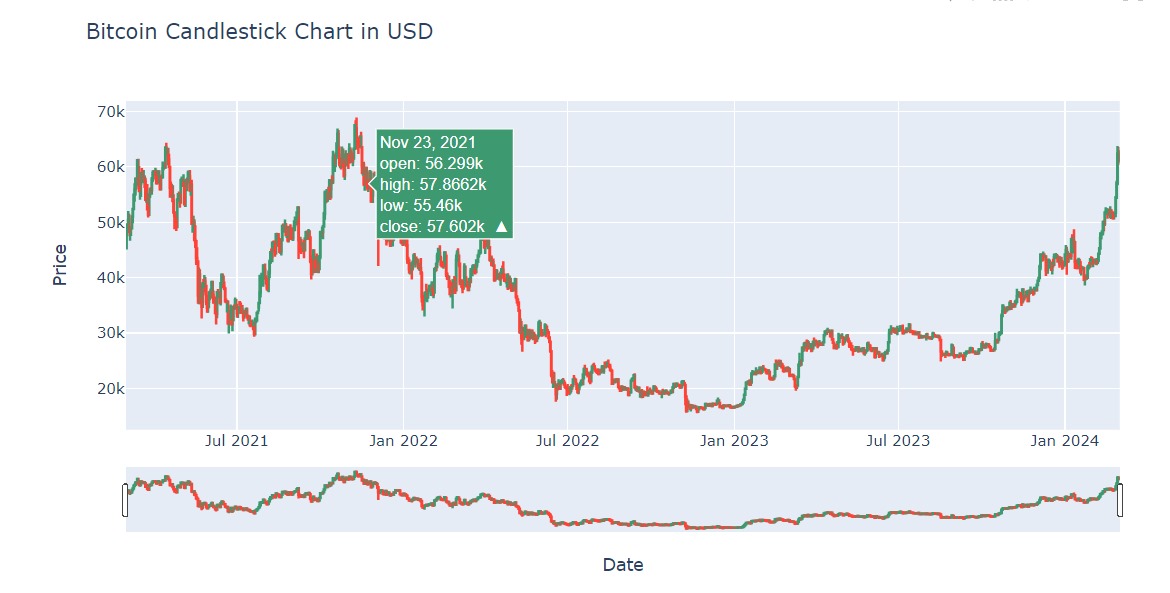
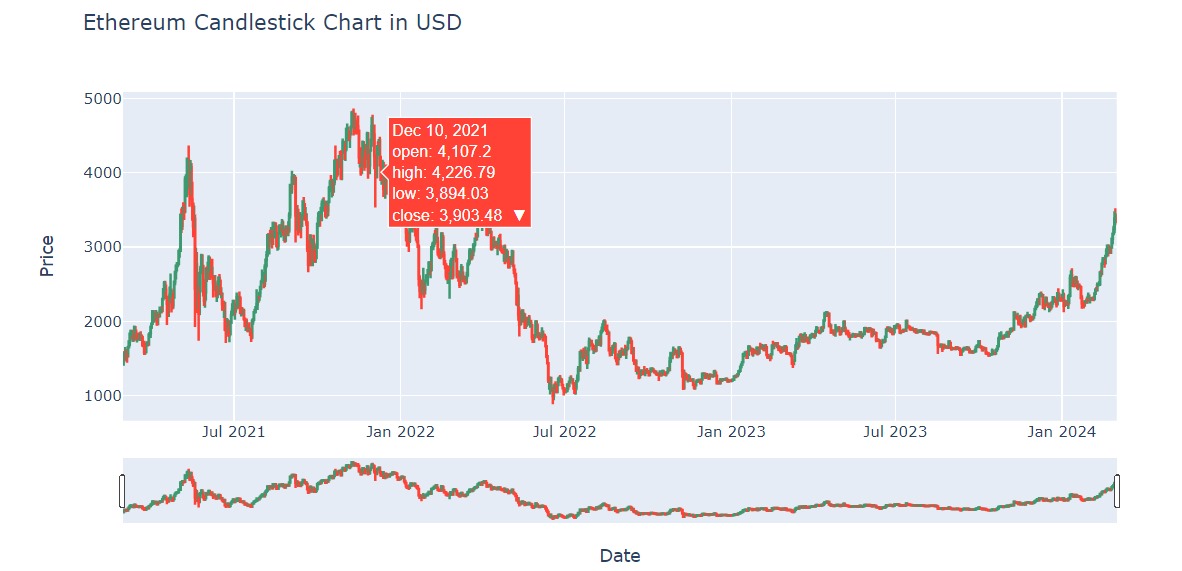
Candlestick charts for Bitcoin and Ethereum from mid-2021 to early 2024 illustrate their distinct market behaviors. Bitcoin's chart shows significant price swings, highlighting its reaction to global market changes and investor sentiment. In contrast, Ethereum demonstrates a steadier growth pattern, suggesting increased investor trust and adoption despite its volatility. These visual representations, with their detailed depiction of trading activity and price fluctuations, provide essential insights into the cryptocurrencies' market dynamics. They reveal Bitcoin's sensitivity and Ethereum's potential for stability, offering valuable perspectives for understanding the evolving cryptocurrency landscape.
Datasets Source: https://www.investing.com/crypto/bitcoin/btc-inr
-------------------------------