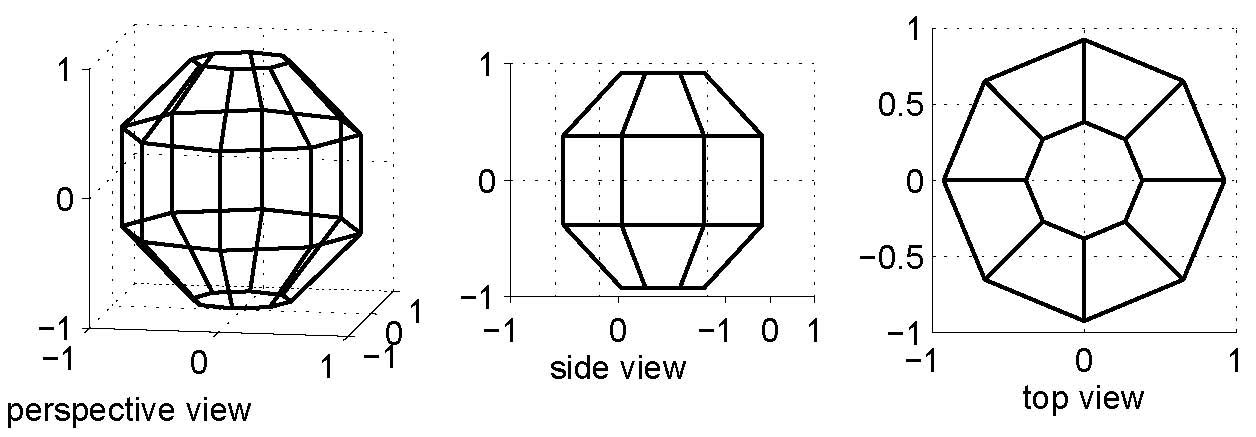
Here we see how to create one particular kind of Sector Globe: the OctaGlobe shown in the figure. The reasoning used here can be used for Sector Globes with a different number of sectors as well.
Projection for Creating an OctaGlobe derives the equations for projecting spherical coordinates on to a flat surface to be folded/taped into an Octaglobe.
Matlab Scripts for Implementing the Projections Described in the Projection Article
projocta.m: Projects (lat-lon) coordinates on
to flat surface for OctaGlobe.
conocta.m: Contour plot projected to flat surface for
Octaglobe.
octavec.m: Create vector field for octaglobe.m.
octacircles.m: Creates latitude circles
and tick marks on OctaGlobe (calls projocta.m).
octapage.m: Set axis size parameters.
octasample2.m: Sample program using other
scripts and bathdeg.mat to create OctaGlobe of coarse-resolution
global topography.
bathdeg.mat: Topographic data used by
octasample.m (about 260kB).
octasample2.pdf: Topography projection
created by octasample.m (about 170kB).
The octasample2.m mscript includes an option to use contour routines from Klinger ToolBox of Matlab Mscripts:
contourfP.m: Version of contourf.m with more control over color palette.
colorpal.m:Color palette selection script called by contourfP.m.
maptoint.m:Script called by contourfP.m; maps continuous range to integers in order to select colors.
Posted: 25 August 2012.
Last modified: 17 May 2016