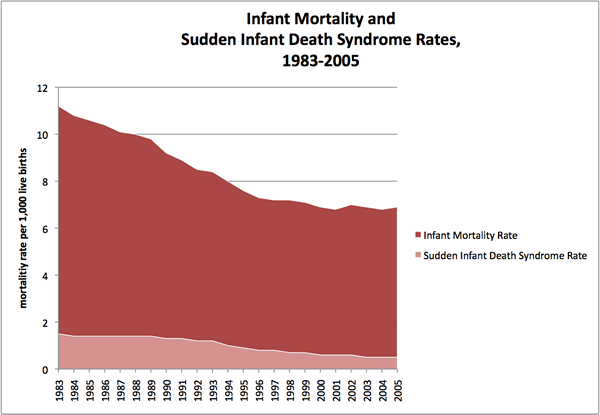
Data Table: Infant Mortality* and SIDS Rate (1983-2005)
| Year |
Infant Mortality Total |
SIDS Total |
Infant Mortality Rate |
SIDS Rate |
| 1983 |
40,627 |
5,305 |
11.2 |
1.5 |
| 1984 |
39,580 |
5,245 |
10.8 |
1.4 |
| 1985 |
40,030 |
5,315 |
10.6 |
1.4 |
| 1986 |
38,891 |
5,278 |
10.4 |
1.4 |
| 1987 |
38,408 |
5,230 |
10.1 |
1.4 |
| 1988 |
38,910 |
5,476 |
10 |
1.4 |
| 1989 |
39,655 |
5,634 |
9.8 |
1.4 |
| 1990 |
38,351 |
5,417 |
9.2 |
1.3 |
| 1991 |
36,766 |
5,349 |
8.9 |
1.3 |
| 1992 |
34,628 |
4,891 |
8.5 |
1.2 |
| 1993 |
33,466 |
4,669 |
8.4 |
1.2 |
| 1994 |
31,710 |
4,073 |
8 |
1 |
| 1995 |
29,583 |
3,397 |
7.6 |
0.9 |
| 1996 |
28,487 |
3,050 |
7.3 |
0.8 |
| 1997 |
28,045 |
2,991 |
7.2 |
0.8 |
| 1998 |
28,371 |
2,822 |
7.2 |
0.7 |
| 1999 |
27,937 |
2,648 |
7.1 |
0.7 |
| 2000 |
28,035 |
2,523 |
6.9 |
0.6 |
| 2001 |
27,568 |
2,234 |
6.8 |
0.6 |
| 2002 |
28,034 |
2,295 |
7 |
0.6 |
| 2003 |
28,025 |
2,162 |
6.9 |
0.5 |
| 2004 |
27,936 |
2,246 |
6.8 |
0.5 |
| 2005 |
28,440 |
2,230 |
6.9 |
0.5 |
|
Sources 1983–1994
Sudden Infant Death Syndrome, United States, 1983-1994. 1996. MMWR Weekly. 45(40): 859-863.
Kochanek, KD, Martin, JA. Supplemental analyses of recent trends in infant mortality. Reviewed October 15, 2008. Hyattsville, Maryland: National Center for Health Statistics.
Sources 1995–2005
Anderson, RN, Kochanek, KD, and Murphy, SL. 1997. Report of final mortality statistics, 1995. Monthly Vital Statistics Report; 45 (11, supp 2). 1-80.
Deaths: Final data [for 1996-2005]. 1998-2008. National Vital Statistics Reports; vols 47-56. Hyattsville, Maryland: National Center for Health Statistics.
Page Last Updated: 07/22/11
Contact Webmaster

