International Financial Support for Ukraine
By Barry A. Klinger, February 2024,
George Mason University, bklinger@gmu.edu
Back to Size-Intensity Plots
Introduction
Many nations, primarily members of the European Union (EU) and NATO, have together donated the equivalent of hundreds of billions of dollars to help Ukraine fend off the Russian invasion that started in February 2022. Political debate within the US and elsewhere often raises the question of how our country compares to others in supporting Ukraine. Size-Intensity Plots are a good way to illustrate this comparison.
Data used here is from the Ukraine Support Tracker created by the Kiel Institute for the World Economy (Trebesch et al., 2023). The Kiel group tracks "commitments" (support pledged by nations) from January 2022 to October 2023 and divides bilateral commitments among "Financial", "Humanitarian" and "Military" categories. A large amount of spending comes from funds managed collectively by the European Union. The Kiel data includes estimates of each individual EU member's share in total EU spending on Ukraine. Here, I have attempted to separately track non-military and military spending, but since the collective EU spending from each country is not divided between military and non-military, I have kept it as a separate category. My understanding is that the collective EU spending on Ukraine includes large amounts of both military and non-military components.
The chart here adds two features to the original data set, which also comes with bar graphs showing various measures of spending. It uses the rate-intensity technique, which is especially well-suited to comparisons of spending. Each bar in the plot represents one country or group of countries. The horizontal dimension of the bar shows the fraction of GDP spent, the vertical dimension shows GDP, and hence bar area (horizontal times vertical dimensions) show the total spending. The fractional GDP gives us a measure of the country's "effort" in assisting Ukraine, and the total spending gives the "impact". Note that GDP is for a given year (2021), but that spending commitments are for almost 2 years and that it will probably take more than 2 years to spend all the pledged funds.
The other factor brought to the data here is combining countries into groups with shared geography and similar spending/GDP levels. This, combined with dropping a few low-contribution countries from the list, reduces the number of national units from over 30 to a more manageable 14 groups. Some common groupings used here are the Baltic states and Scandinavia; however the Eastern Allies group includes Eastern European countries but only those with relatively high level of per capita spending on Ukraine.
Results
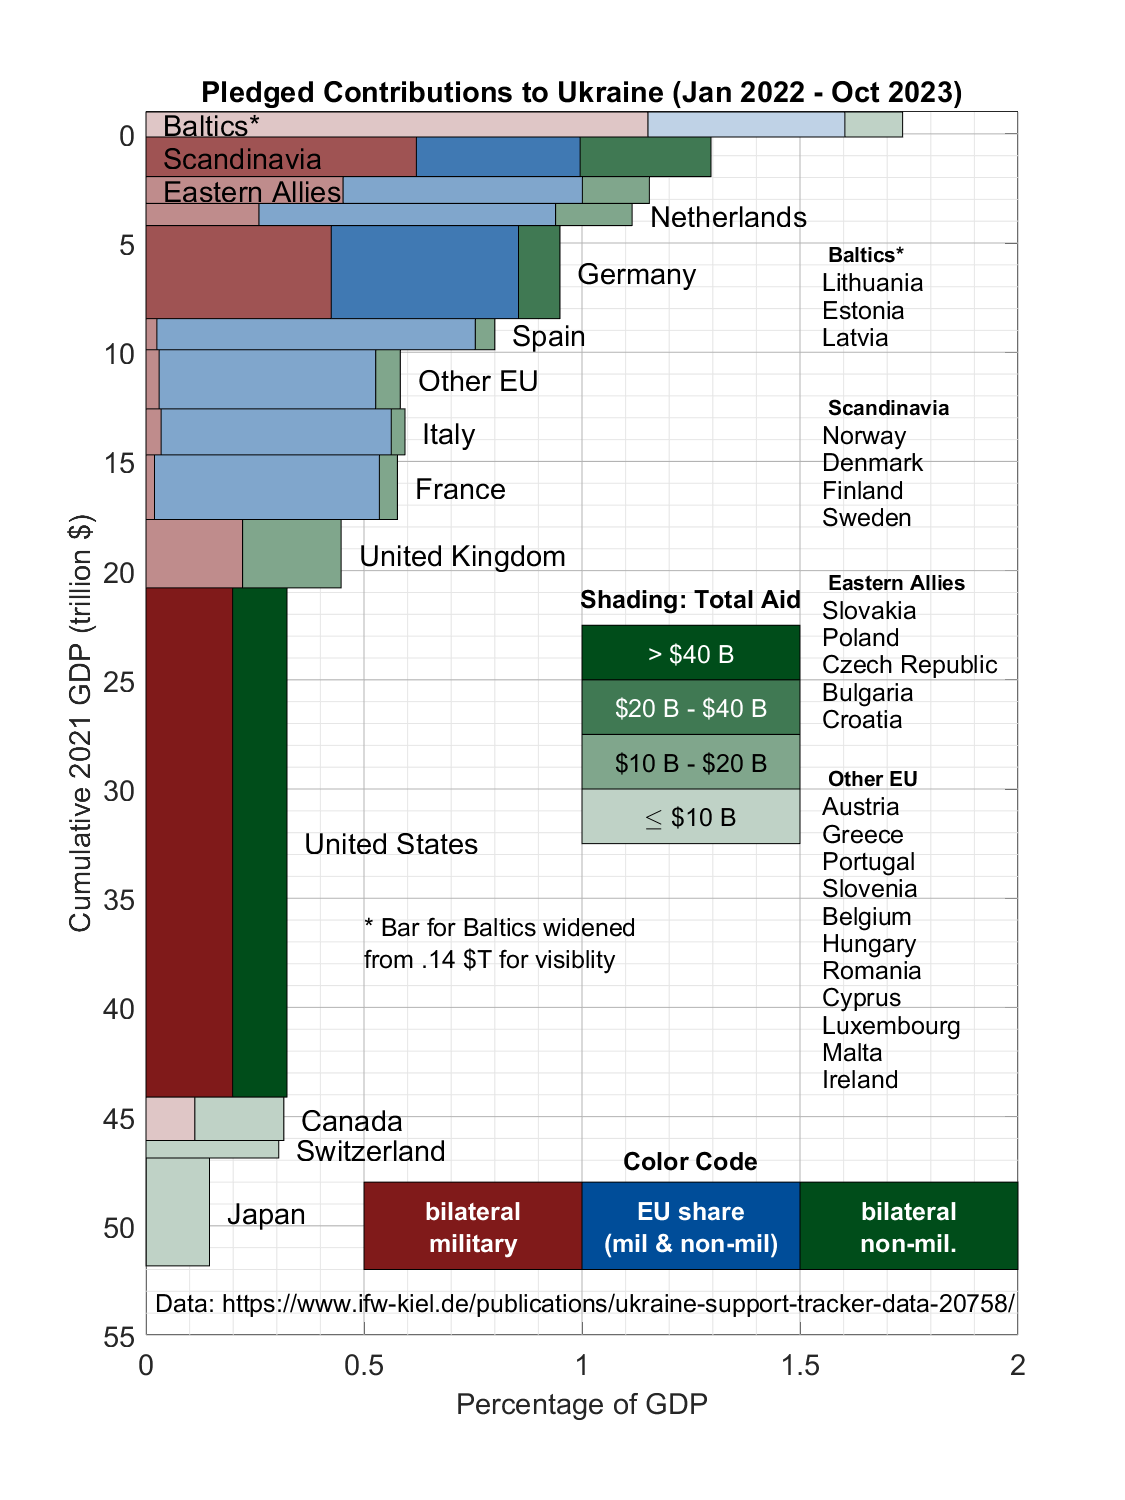
The plot shows that in terms of spending per GDP, the United States is doing less in both the military and financial/humanitarian areas than Germany, Scandinavia, the United Kingdom, and some other groups of countries. The Baltic nations are spending the highest fraction of GDP on Ukraine, over 1.7%, with some other Eastern European nations, as well as Scandinavia, and Netherlands, not far behind. It is understandable that most of these countries would be eager to deter Russian aggression, but interesting that the Netherlands' contribution is almost as large even though it is relatively far from Russia.
These countries and Germany are making large bilateral military contributions. Most of the other EU nations, including France, make most of their contributions through the EU mechanism, which does not allow us to separate military from civilian spending. Other notable features include the fact that the UK spends more per capita than the US in both categories, Canada is about the same as the US, and even Japan is contributing substantial nonmilitary support despite distance from Europe.
When we look at total spending (highlighted by degree of shading), the United State's large GDP (due to both a large population and higher per capita income than Europe) translates its smaller spending per GDP (about 0.3%) into the largest single contribution, over $70 billion. Only Scandinavia and Germany fall into the $20-$40 B category, and most EU nations give between $10 and $20 B. Since the Baltics only have a combined population of about 6 million people, their high rate of spending still amounts to less than $10 B overall.
The combined European GDP of over $20 trillion, comparable to that of the US, means that Europe as a whole spends more than the US: over $160 B.
Conclusion
Tracking spending is complex, and one can choose a myriad of different ways to measure disbursed, pledged, cash, in-kind, and other categories of activity. How does one count a German or American tank transferred to Ukraine? How does one compare a euro spent in Poland with a dollar spent in America? Still, American press accounts tend to give the impression that the US provides the main, or even the only, significant support for Ukraine, and even if we view these number skeptically, we can see that that view is not correct.
Reference
Trebesch, C., et al., 2023: The Ukraine Support Tracker: Which countries help Ukraine and how?" Kiel Working Paper, No. 2218, 1-75.
Chart was made by me with Matlab code; programs available upon request.