"States Within States" in the 2016 Election
Barry A. Klinger, 18 August 2020
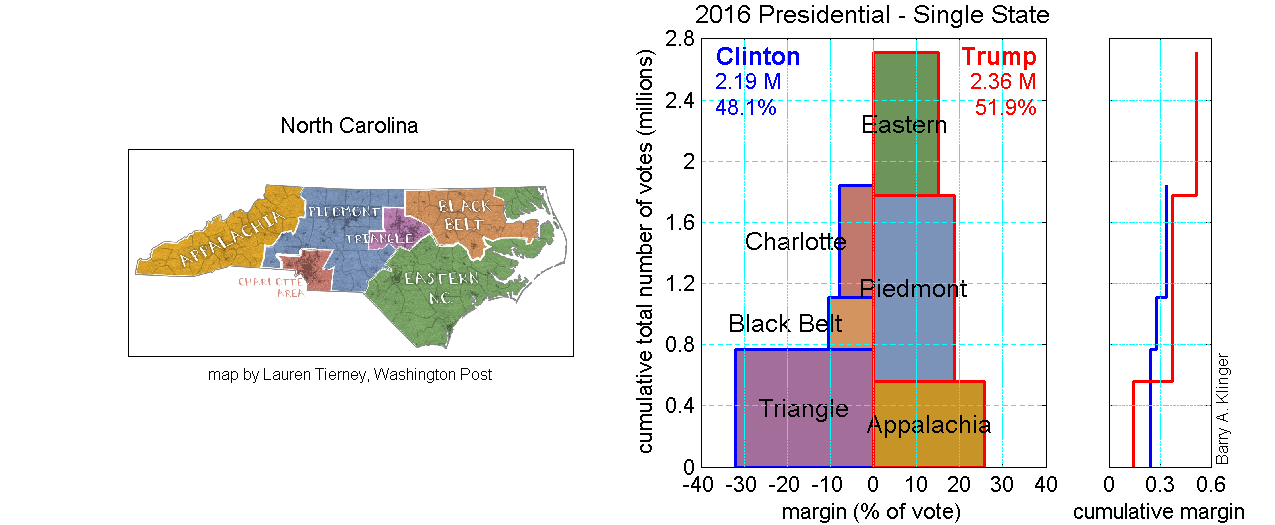
The middle panel in each figure below shows the breakdown of the popular vote among the "substates" shown in the left panel. As in The 2016 Presidential Election, the height of each box in the figure represents the total number of votes, and the width represents the percentage margin voting for the candidate who won in that region. Therefore the area measures the total number of "excess" votes for that candidate. The sum of all the areas for the winning candidate minus that for the losing candidate gives the total margin of victory. Both candidates are trying to win by amassing the largest possible area of blocks.
Florida [Washington Post Article]
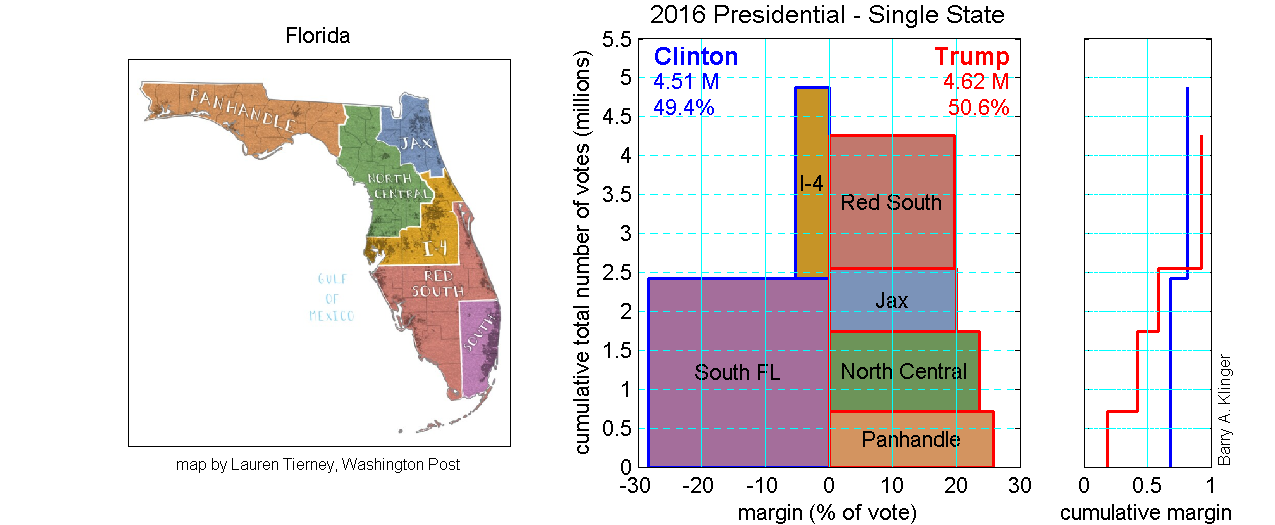
With a population of nineteen million, Florida is the third largest state and the most populous swing state. As in the country as a whole, a relatively small area that is highly urbanized has about the same population as a much larger area that is composed mostly of rural and wild areas. And, like the country as a whole, the more urban areas went for Clinton while more rural areas went for Trump. Not shown in the map, smaller urban islands in Republican-leaning regions - for example Tallahassee and Gainsville (both with large state universities) - also voted Democratic but did not have a large enough population to overcome the surrounding Republican-voting areas.
In Florida, there are some particular cultural factors. Much of the northern half of the state is culturally and politically similar to the rest of the US South. South Florida has cultural roots in the US Northeast and in Cuba and the rest of the Caribbean. The I-4 corridor is heavily influenced by the tourism industry nucleated by Disney World and by high tech workers associated with the space agency and related industry. It's interesting that all the Republican-leaning substates went by about the same amount, 20-25%, for Trump.
Wisconsin [Washington Post Article]
.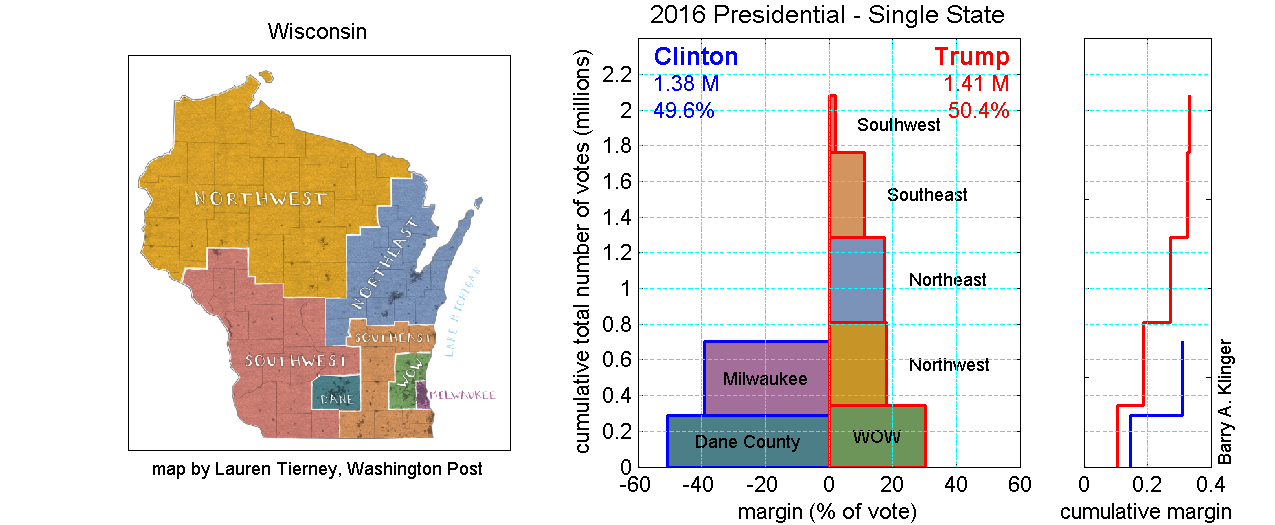
Wisconsin went for Donald Trump by the thinnest of margins in 2016. As the Washington Post article discusses, when Wisconsin is divided this way, the only regions to vote for Clinton were the two largest cities, Milwaukee and Madison (Dane County). The distribution is somewhat similar to the results of the national election, in which a handful of more urbanized states went for Clinton. However, on the national scale, the small area represented by those states contained about as many people as the strongly pro-Trump states. Within Wisconsin, the Clinton strongholds together only account for about a quarter of the total votes cast in the state.
How then did Clinton virtually tie Trump? The reason is the remarkably strong partisanship of the Clinton substates. In Dane County, three times as many people voted for Clinton as for Trump. The other regions tilted towards Trump, but in most cases by less than 20% margins.
North Carolina [Washington Post Article]