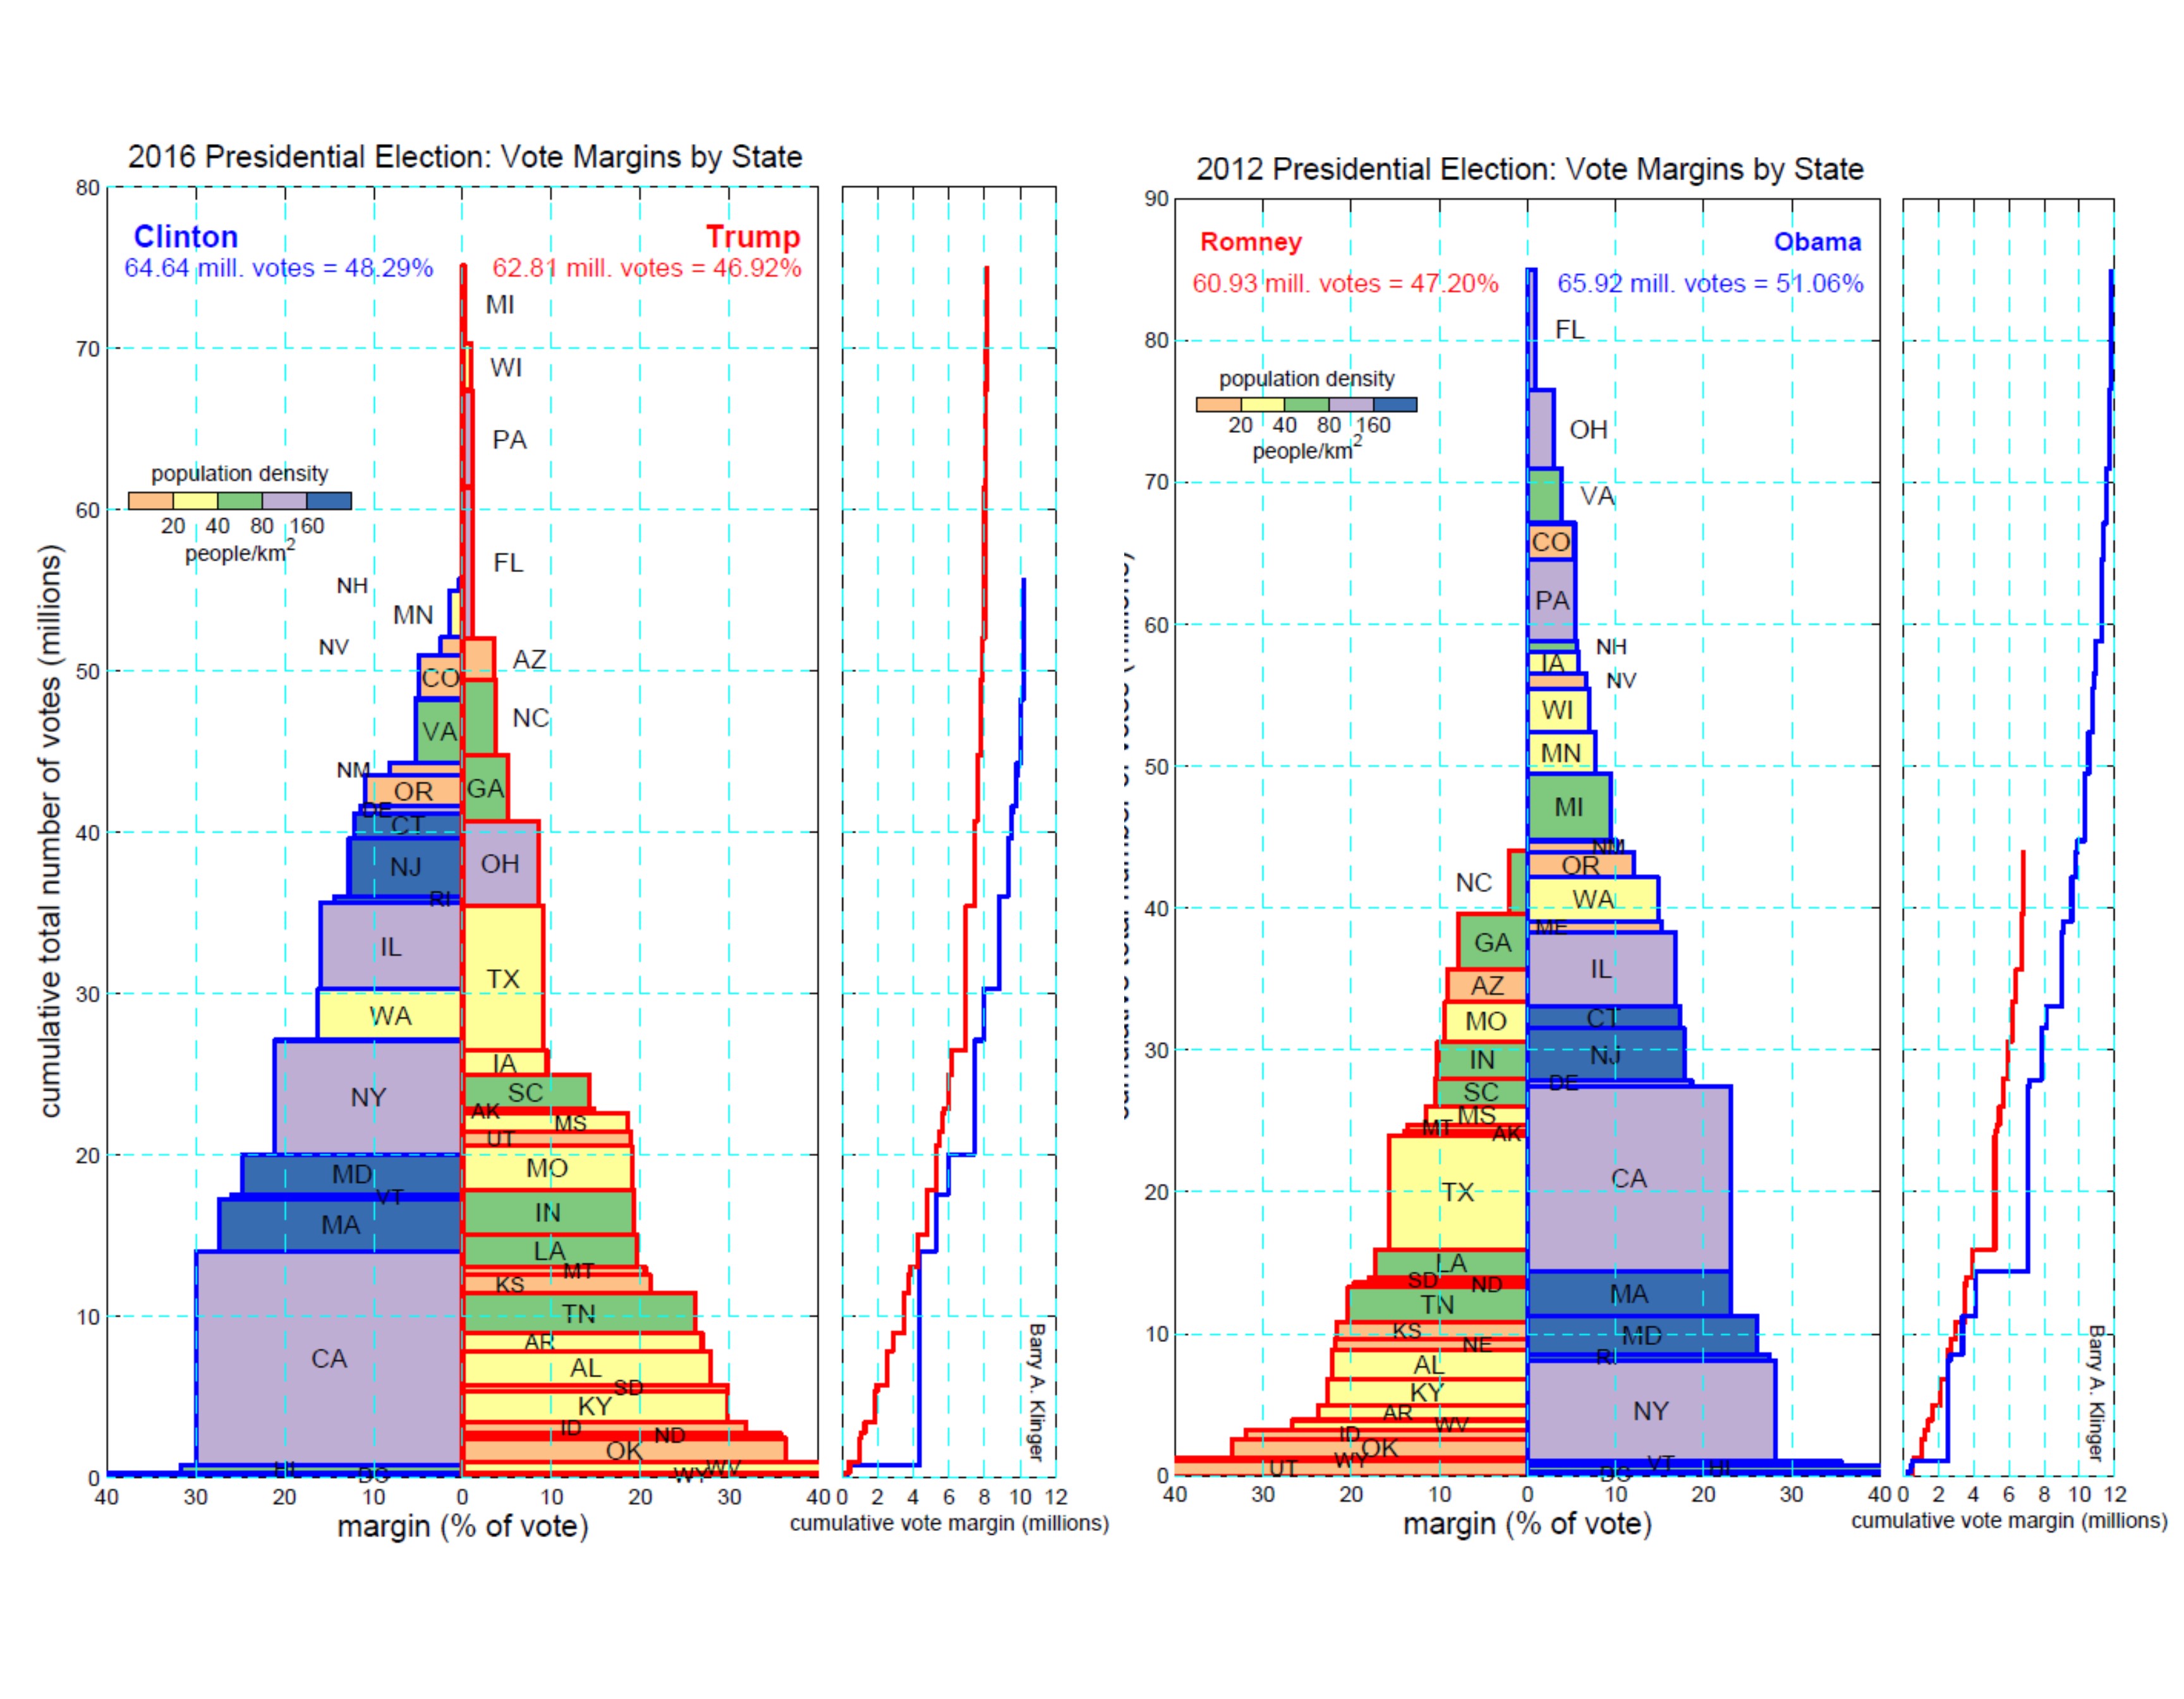
The figures summarize how the Democratic and Republican Presidential candidates did in individual states. Each rectangle in a chart represents a single state. A rectangle's width shows the percentage margin of victory of the candidate who won in that state, its height shows the total number of votes cast in that state, and hence its area gives the number of voters in the margin of victory. For more about the charts, see "How to Get a Majority in the Presidential Election" further down on this page.
This was the fourth election out of the last five in which the Democrat got the most votes. [Note: preliminary count as of 11 Nov for 2016 data has been updated 29 Nov 2016. Final numbers may still be different.] Thus for the 2016 election, the area of the Democratic stack of votes on the left is slightly larger than the Republican stack on the right. The chart shows how Trump's defeat in the popular vote translated into an electoral college victory: margins of error of less than 2% in swing states FL, PA, WI, and MI, as well as a more decisive victory in OH meant that about 20 million more voters lived in states that went for Trump than in those that went for Clinton. In OH, PA, WI, and MI, it is plausible that Trump's championing of protectionist measures to revive US manufacturing jobs tilted the balance.
In other respects, individual states voted about the same as they did in the 2012 election. Clinton won by similar margins to Obama in the states of the Northeast and the West coast, and Trump won by similar margins to Romney in the South and central western states - worse in TX but better in several other states. Nationally, Trump got more votes than Romney, but Clinton got nearly as many as Obama. Despite the many bizarre episodes of the 2016 race, overall the partisan split among states was similar to other recent elections except for the narrow (and in OH, not so narrow) Republican victories in industrial northern states.
How have presidential candidates put together majorities to get elected? Here we use a new method of displaying election results in order to see the distribution of votes among states for recent presidential elections.
Let's look at the popular vote. In order to see how each state helped or hurt a candidate, we examine the margin of victory (difference in votes for the two candidates) in each state. In the graph shown below, for each state, a rectangle represents the margin of the candidate that won in that state. The width of the rectangle shows the margin as a percentage of the total vote. This indicates the intensity of the support for the winning candidate. The height of the rectangle gives the total number of votes in the state, which determines how much the percentage contributes to the national total. For example, in the panel showing Romney vs. Obama, California went for Obama with a margin of about 22% of the roughly 13 million votes. Therefore in California Obama earned about 3 million more votes (=.22 x 13 million), which is represented by the area of the rectangle.
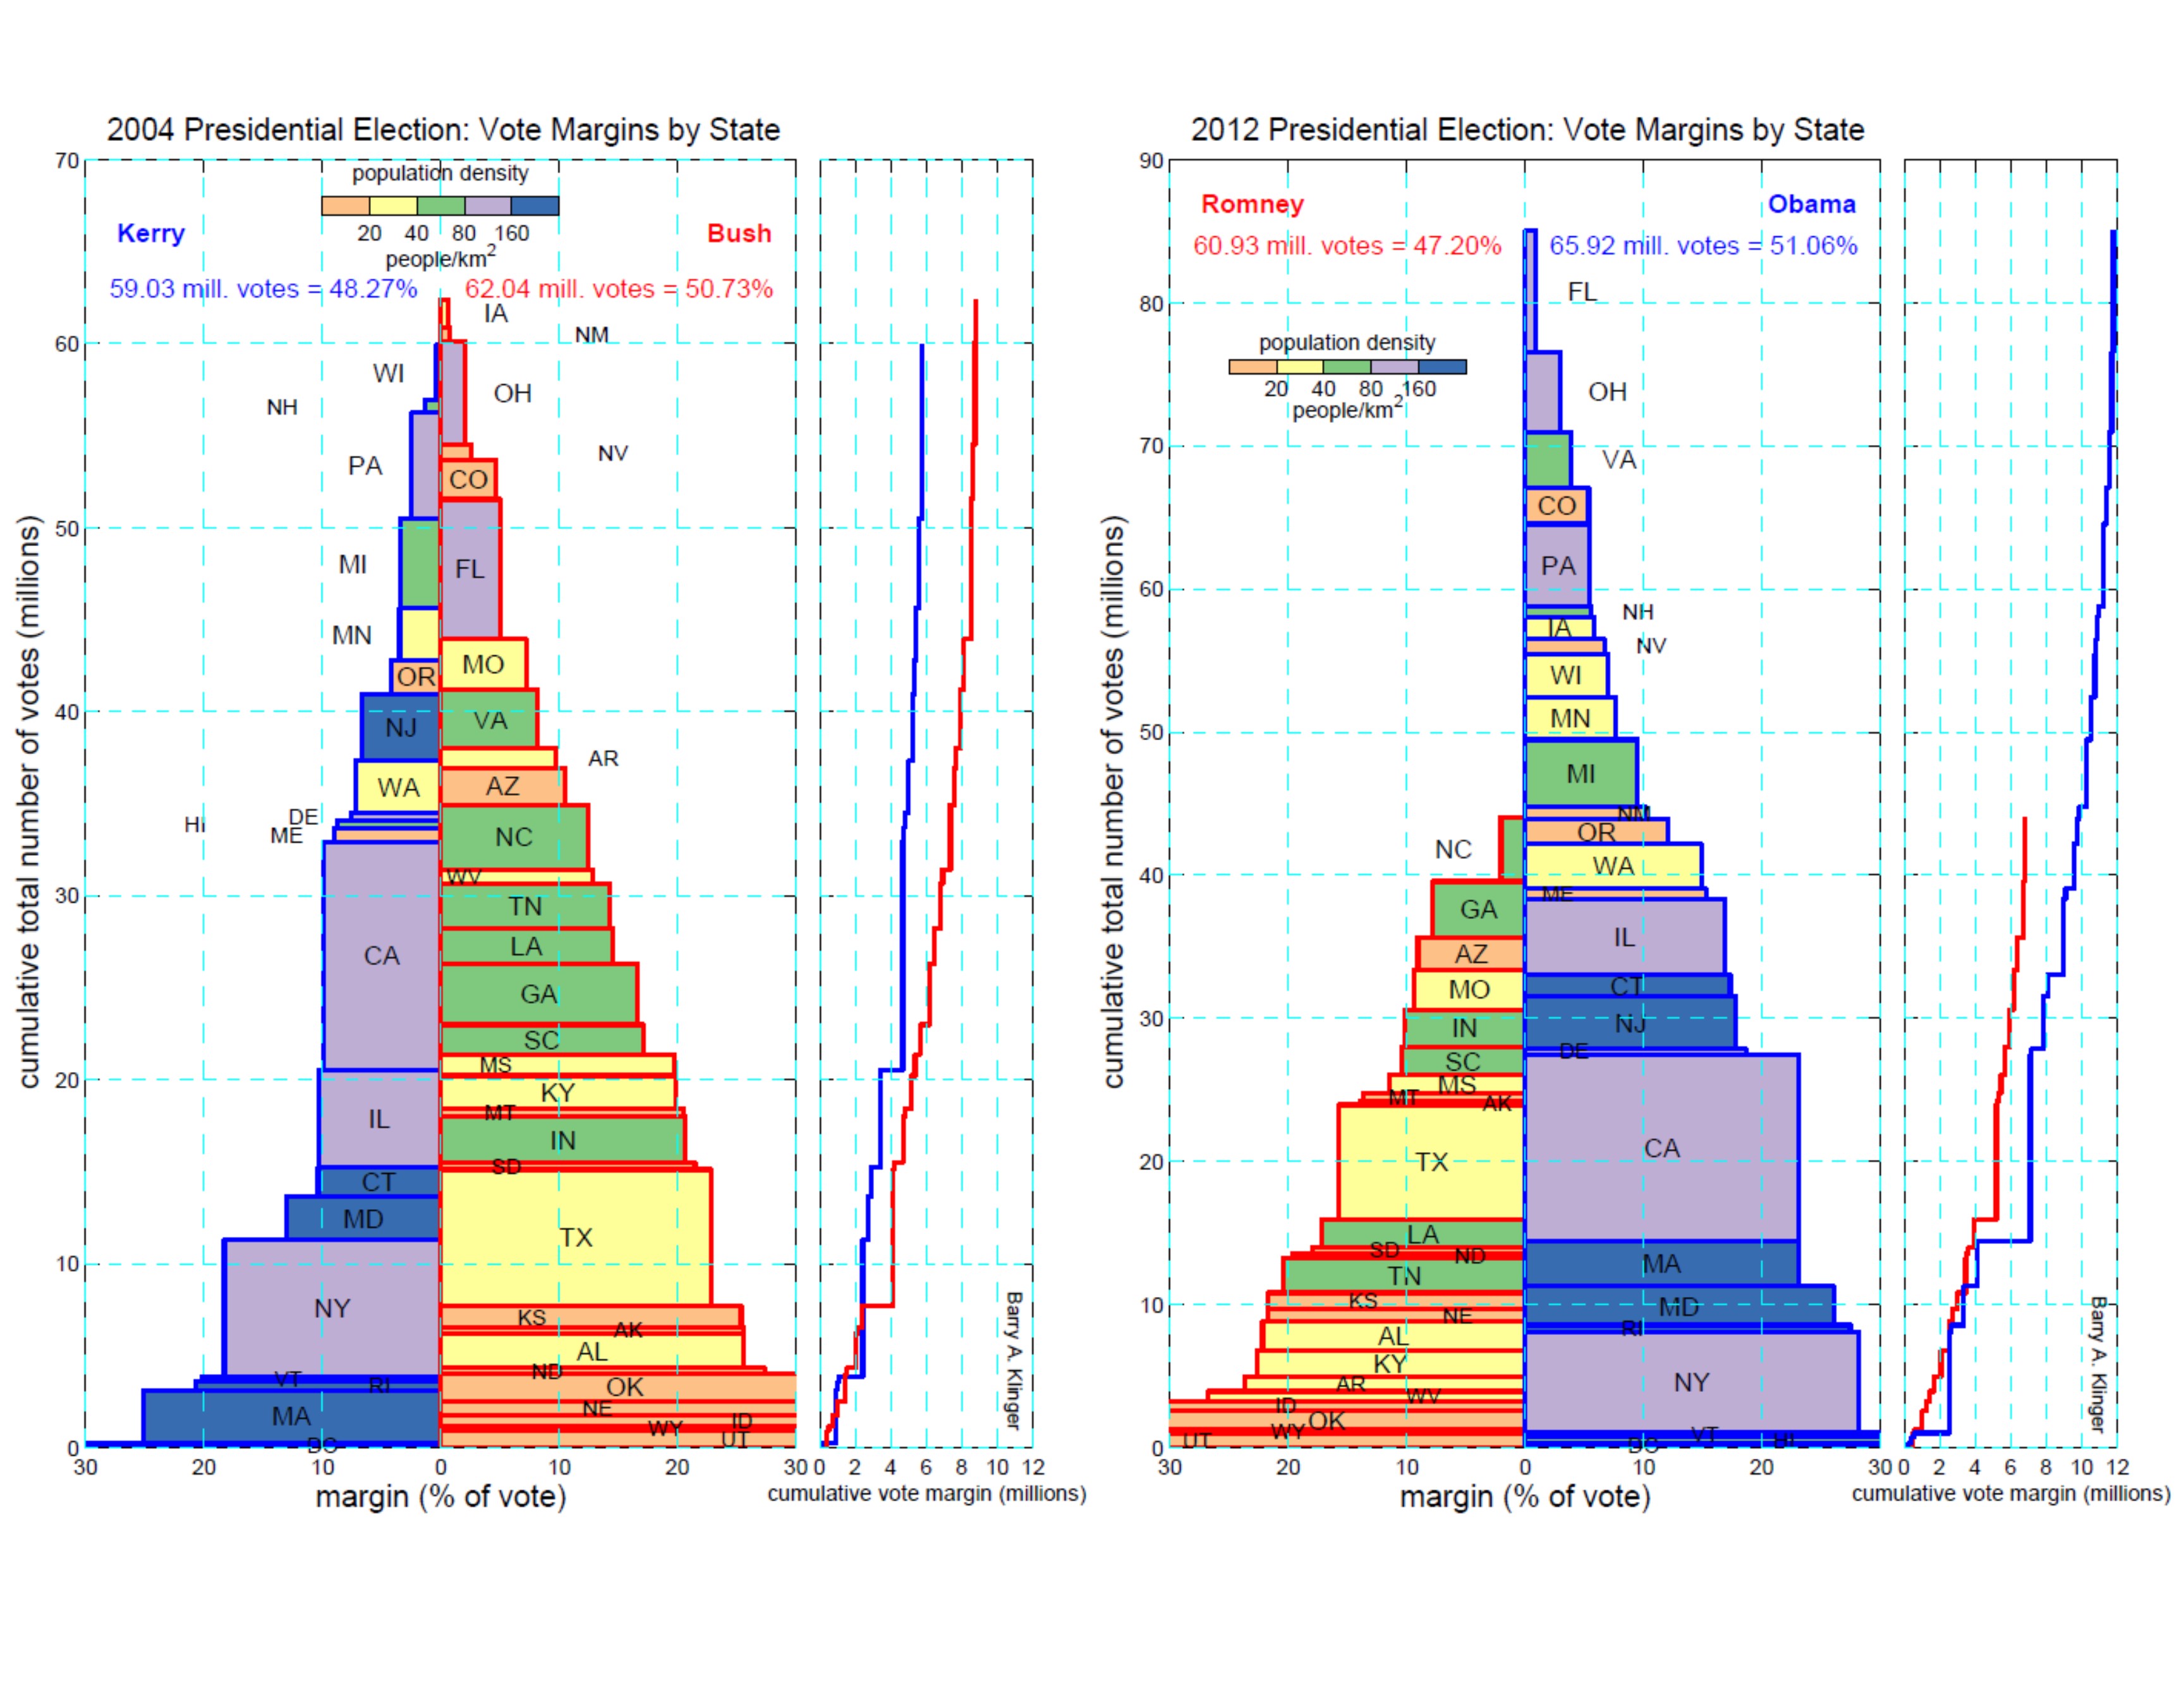
The rectangles representing states are stacked based on percentage margin of victory, a stack on the right for the national victor and another on the left for the defeated candidate. The graphs show that:
The core Democratic states include sizable contributions from some geographically small states such as Maryland, Massachusetts, and New Jersey. Their electoral impact indicates the high population density of these states. Similarly, the Republican core includes most of the geographical area of the country, but not a correspondingly large fraction of the population. If acres or hectares could vote, the elections might all be determined by Alaska (population, .7 million). The state rectangles are color coded by population density. This allows us to see the strong polarization between high-density states voting Democratic and low- and medium-density states voting Republican. The most Republican states are the most sparsely populated though the states with intermediate densities such as Indiana, Georgia, and Tennessee tend to vote Republican. No high-density state voted Republican in both elections, though key swing states (Ohio and Florida) also have high densities.
Since some Democratic-voting states in New England and the West Coast voted with the others in their geographic region despite having very low (Oregon, Maine) or low (Washington) densities, it is tempting to say that the correlation between population density and voting is only coincidental and that the voting patterns are explained by regional factors. On the other hand, county-by-county voting maps show that even within Republican-voting states, small patches corresponding to major cities voted Democratic.
A plot of cumulative votes (to the right of each margin-population chart) shows the combined impact of the states voting for each candidate. In these plots, one stairstep curve shows the performance of each candidate, the vertical axis is the total number of votes (as in the other chart) and the horizontal axis is the cumulative number of excess votes for the candidate. The topmost value of each curve shows the total population voting in all the states in which the candidate won (vertical axis) and the sum of all the margins (horizontal axis). The difference between the sum of margins for each candidate gives the national margin; for instance, in 2012, Obama got 12 million more votes than Romney from states that Obama won, Romney got nearly 7 million more votes than Obama in the other states, and 12 - 7 = 6 is the national margin (66 million to 61 million votes).
In 2012, just California, New York, Massachusetts, and a few other states with margins of over 20% gave about the same number of excess votes for Obama as Romney got from all the states in which he won.We have ignored the electoral college, which complicates the relationship between the popular vote and the election outcome. In any case, out of the scores of presidential elections over the history of the country, only three have delivered an electoral college result that was different than the popular result (and in the third instance, Bush vs. Gore, there was widespread disagreement over who should have won in the electoral college). [29 November note: ha!]
Since the electoral college delivers votes that are (very roughly) proportional to the voting population,* the vertical axis of the chart gives some indication of the electoral vote. In 2004, Bush electoral votes divided by Kerry electoral votes was 1.14 and the ratio of total votes in states in which Bush won to those in which Kerry won was 1.03. In 2012, the electoral college ratio was 1.89 and the total vote ratio was 1.61.
*[For the most part, voters/population does not vary that much among the states. Electoral votes are roughly proportional to state population, though favoring small-population (and generally Republican-leaning) states.]
These charts give us a new way to look at the vote distribution in elections. With talk (mostly evidence-free) of election fraud floating around the blogosphere, it is interesting to see that in nearly every state the victory margin is at least a few percentage points and 100,000 votes. A lot of effort would be needed to organize voter impersonation on a scale large enough to switch the state's majority. The chart illustrates the degree of political polarization in the country, with about half the national population living in states that overwhelmingly vote one party, and half the national population living in more evenly divided states. Which candidate wins the popular vote depends both on swing states selecting a candidate and on the size of the margin in the partisan states.
This kind of chart gives a compact summary of a presidential election. It may be interesting to use it to compare results over more elections.