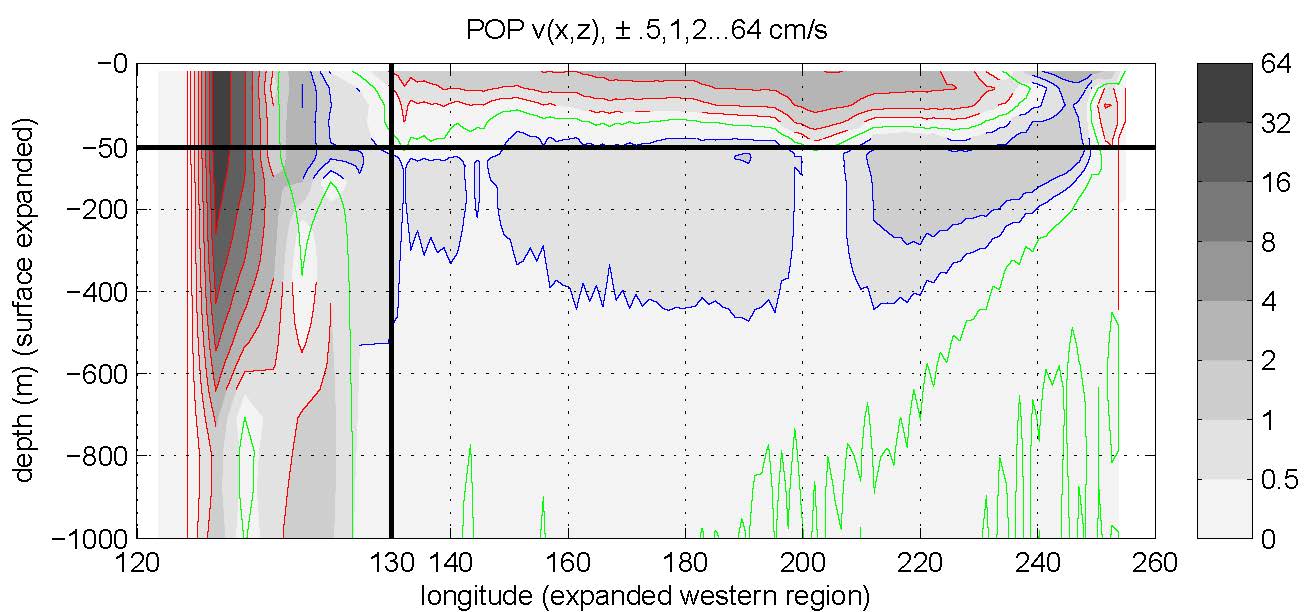
% red/blue/green line colors show sign and
% shading shows magnitude.
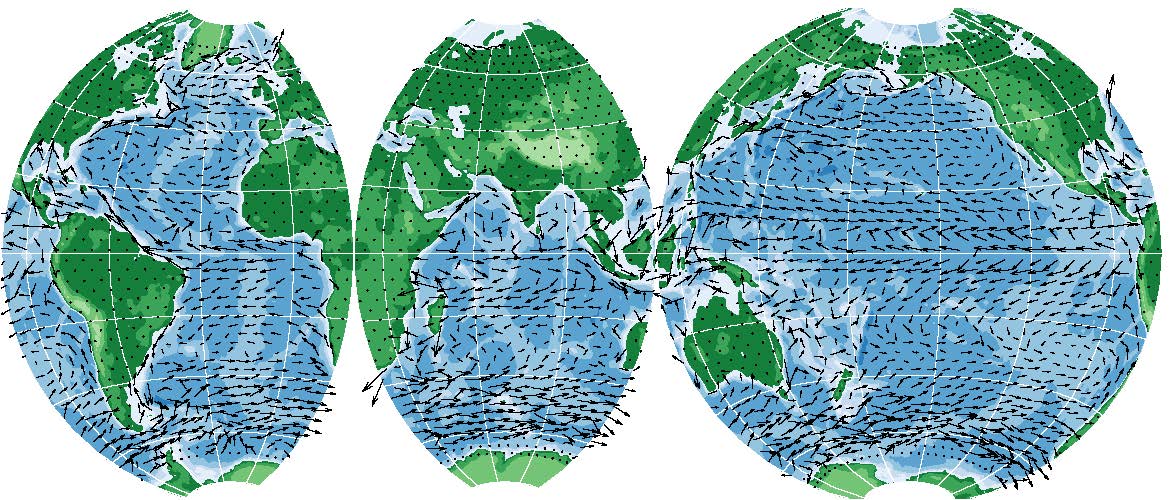
These are a few of the Matlab scripts I have found useful over the years. They include graphics routines I have written, a collection of more specialized graphics routines for plotting a projection of points, vectors, and contours from a surface of a sphere (such as the Earth), and some routines for quantities involving the equation of state of seawater (such as seawater density).
Update 2015: I've added a powerful new version of contourf which allows the user to easily combine colors from a menu of palettes, added a polar view to the map projection routines, and did a number of smaller improvements on other programs.
Listing of
Mscripts including some intro material.
Guide to Using
Mscripts including advice about graphics.
Archive of
Mscripts, .mat files, and Documentation (TAR format, about 7 MB).
For higher resolution of the image above, see
Guide.
[Note: in Guide, some colorbars are not shown correctly when I
look at them in Firefox for Windows 7, but are correct when viewed
directly in Acrobat.]
AOES Dept Home Page
Klinger Home Page
Last modified: 12 June 2018