Image Manipulation and Compression with Fourier Analysis and Wavelets via Gabriel Peyrè
Part II: Fourier and Wavelet Analysis
In this section, I will continue my analysis of the image of myself. This will be done first via Fourier methods, and secondly, by Wavelet techniques. I assume that the reader has a familiarity with basic Fourier Analysis methods, so I will not go into much explanation or detail in regards to the Fourier part of this section. However, I will go into more detail about Wavelets, since I myself am trying to come to terms with this new basis.
I reiterate, I am currently reading the fine book "A Wavelet Tour of Signal Processing the Sparse Way," by Stephane Mallat. Very conveniently, he has a website with informative links and most importantly, Matlab Code! This is invaluable for someone like myself, as it spares me the task of implementing operations in Matlab. The link to the code is listed below:
Valuable Links Here
Now, a Linear Fourier Approximation is implemented via Mr. Peyre's code. This is a rather crude method in my opinion. In this implementation, one takes the DFT of the image, and sets all of the Fourier Coefficients to zero, outside of some band of their choosing. In this implementation specifically, Mr. Peyre keeps only the first 65 x 65 Fourier Coefficients. This represents a very crude compression as well. The SNR in the title of the filtered image is the Signal-to-Noise-Ratio, which is given by:
With SNR, a higher number is better.
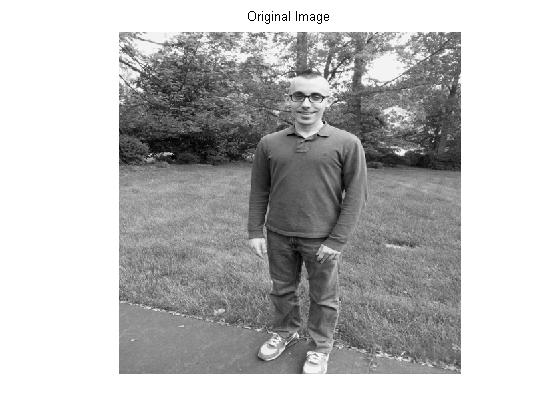
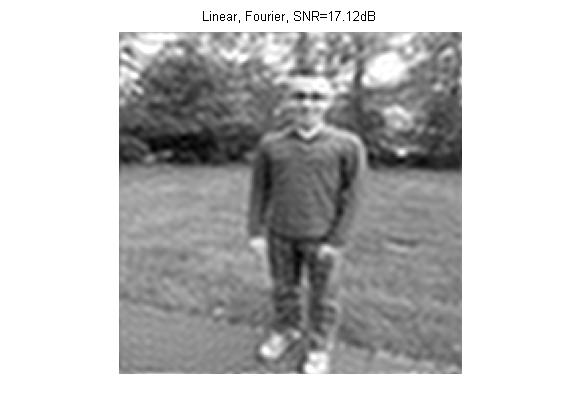
Suffice to say, this doesn't look very good. However, the vasty marjority of the information about the image was thrown away, and one can still get a decent idea of what was going on in the photo.
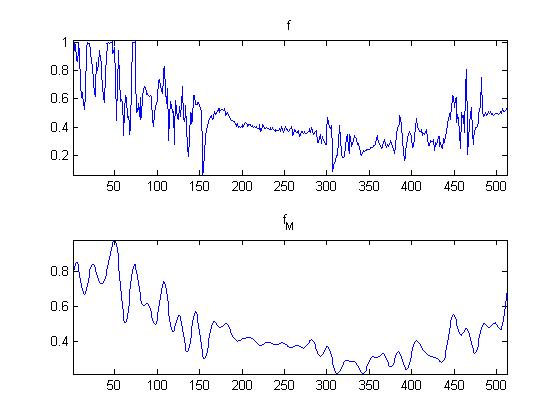
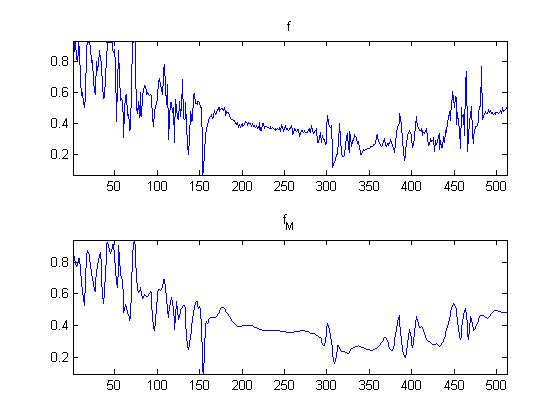
Here, Mr. Peyre does a 1-D comparison of the lines of the images. Notice the abscense of the high oscillations in fM. This makes perfect sense, as the high frequencies were wiped out in the linear approximation.
Next, a Non-Linear Fourier Approximation is implemented. Might this method be better than the linear one? Again, this method is not terribly sophisticated. One decides on an arbitary threshold for their Fourier Coefficients, in the case of Mr. Peyre, he chooses .2. Now, any Fourier Coefficient of magnitude greater than .2 will be kept, and any less than .2 will be 0. Of course, one can adjust the threshold to their liking.
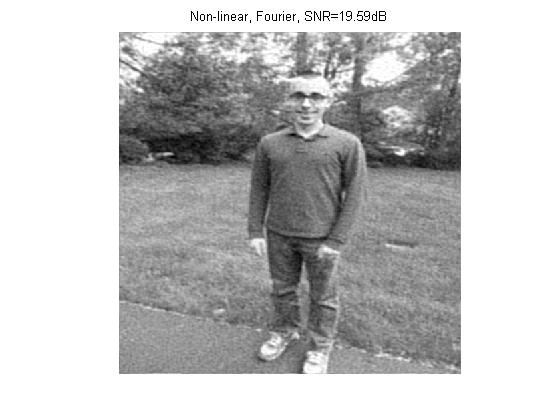
This method offers an improvement of the linear approximation. Again, I assume that one has some familiairiy with Fourier Transforms. All that was done by Mr. Peyre's code was simple compression methods with Fourier Analysis tools. These tools are useful because they let us achieve some kind of compression, without cutting out portions of the image itself. Next, we move on to Wavelets...
What the heck is a Wavelet?!?!?
I will start from an aesthetic point of view. The image above shows one of the more famous Wavelets, accredited to Ingrid Daubechies. This "Daubechies Wavelet" resembles a wave, to some degree. It has a crest and one could imagine it rising and coming crashing back down. That's where the "wave" part of Wavelet comes from. The "let" at the end comes from the diminutive nature of Wavelets. As you can see in the plot above, the Wavelet starts at zero, rises and falls, and then goes back to zero.
Of course, being a mathematician, unfortunately aesthetic appearances are a secondary concern. From a mathematical point of view, a Wavelet is a basis to which a function can be projected onto.
From Linear Algebra, we know that a basis is a sequence or collection of vectors that spans a space and is linearly independent. In the same manner that one via projections can decompose a simple vector in
into unit vectors, one can decompose a function (or a signal, same thing), onto a basis of their liking. That is exactly what one does with Fourier Analysis, with the Fourier Transform. One extends the notion of orthognality, inner product, and projections from vectors to functions and breaks a function or signal (depending on ones background)
into simpler components. In general functions from the
space are used in Wavelet Transforms.
Fourier Analysis is very good for many tasks. For example, in my Signals and Systems class, the Fourier Transform made filtering very easy. This is because the Fourier Transform
diagnolizes LTI systems. As we have seen so far, Fourier tools are also able to compress audio and image signals. It is for these reasons and countless others that one
projects a signal onto the Fourier Basis. By performing an integral or more practically a DFT, one is able to achieve their signal processing objective. However, the Fourier Basis has shortcomings.
For one, it is not localized in the time domain. By time localized I mean that the basis element quickly
goes to zero. This is not the case with sines and cosines, but it is with Wavelets (see above image). As we know, sines and cosines are continuous and go on forever. Additionally, Wavelets have a
multi-resolution property which Fourier does not. With Wavelets, one is able to zoom in on their function at different levels. This is akin to seeing Earth, then the United States, then the East Coast...
etc. In practice, the number of levels one can zoom in is finite and is given by: .
Multi-Resolution analysis gives one more sensitivity in their applications than they would have if they used Fourier. However, by going to Wavelets from Fourier one loses a valuable property of the
Fourier Basis - complex exponentials are differential operators. One trades that property for an increased level of sensitivity in their analysis.
With Fourier Analysis one uses long waves, sines and cosines, to break a signal down into it's frequency components. With Wavelets one uses little waves to break a signal down into different scales. Wavelets are decently localized in time and frequency, where Fourier basis elements are only localized in the frequency domain. This is a very important idea to take to heart.
The idea of localization is very important with Wavelets. Being localized means that something starts and ends at zero. Ideally, one wants to use a basis that is localized in time and frequency. However, due to the Heisenberg Uncertainity Principle, that is not possible. The better you can do in one domain, the worse you do in the other. For example, the delta function is extremely localized in the time domain. However, it's Fourier Transform is 1 for all omega. Wavelets on the other hand try to do as best as possible in both domains at once. Sinces and Cosines from Fourier Analysis are definitely not localized in time. By using elements that try as best as physically possible to be localized and time and frequency, one gets a different perspective in their signal processing, as well as the possibility of better compression.
For these reasons, individuals in various fields came up with Wavelets. Wavelet have applications in many fields, such as image compression, audio compression, signal processing, and fluid flows. One defines a Wavelet basis as follows below:
For a more in depth explanation, I recommend Mallat's book, or Gilbert Strang's book. All that is happening is that one is shifting and scaling
around. It can get shrunk by various powers of 1/2, and then one shifts it in time as needed. The time shift is analogous to shifting the unit step or Heaviside function
around. Now, one might also notice that
is not defined. That is because
there are many different types of Wavelets that one can use. The choice one makes depends on the application they are using it for. Is this a projection? Absolutely! The
inner product is given below:
Of course, this is far from a rigorous definition. Mr. Mallat's book is very good, albeit very advanced as well, and Mr. Peyrè's site is excellent also. The important takeaway is that behind all the complicated proofs, is the simple fact that we are simply projecting onto another basis. Why? Because this basis offers advantages over other ones like Fourier. Even among Wavelets, one must choose the best Wavelet to use in their application. There is no Wavelet that is the best for all applications. Next, in the same manner as I did with the DFT, I am going to perform linear and non-linear filtering with a Wavelet Basis. Of course, this is with the help of Mr. Peyrè's code.
Now, we use Mr. Peyrè's perform_wavelet_transform function on the black and white image of myself. The image is resized to dimensions of 512 x 512 as well. As of now, I am not sure as to what kind of wavelet is being used specifically. Nevertheless, given below are the transformed Wavelet coefficients.
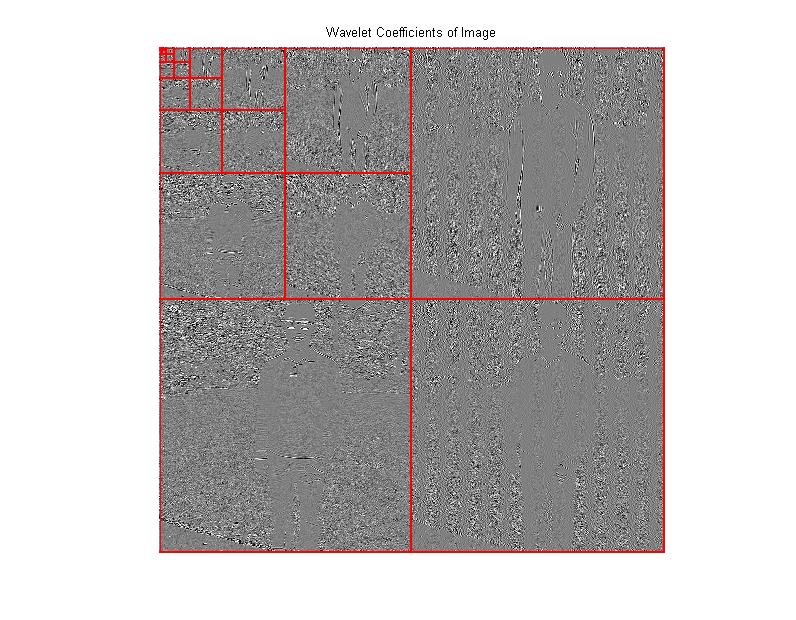
This image above is explained more thoroughly in sections to come. What is happening here is at each stage of the Wavelet Transform, the photo is being passed through low-pass and high-pass filters. This process seperates an image into its high and low frequency components. This leads to the construction of filter banks. Much more is said later about this.
Next, in exactly the same manner as was done with Fourier, a linear approximation is implemented with Mr. Peyre's code.
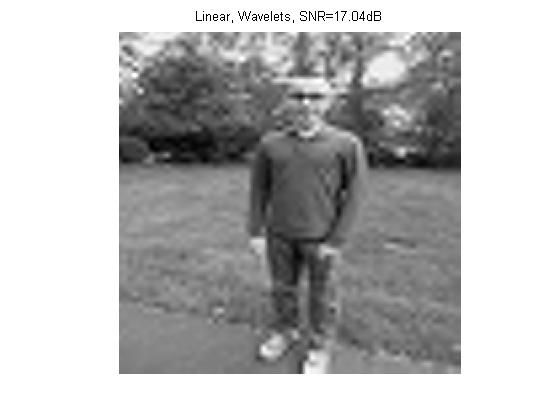
This looks pretty bad. It is ever-so-slightly worse than the Linear Fourier Compression above.
Next, a non-linear thresholding is implemented. This is exactly the same as the one used with Fourier. To recap, a threshold of T = .2 is initialized. All wavelet coefficients greater than .2 are kept, all coefficients less than .2 are wiped out to zero. Plots of the original, and non-linear thresholding versions are given below:
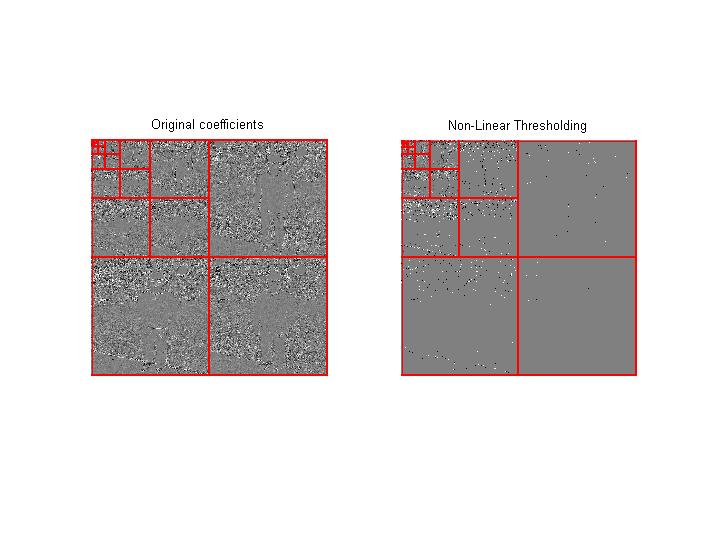
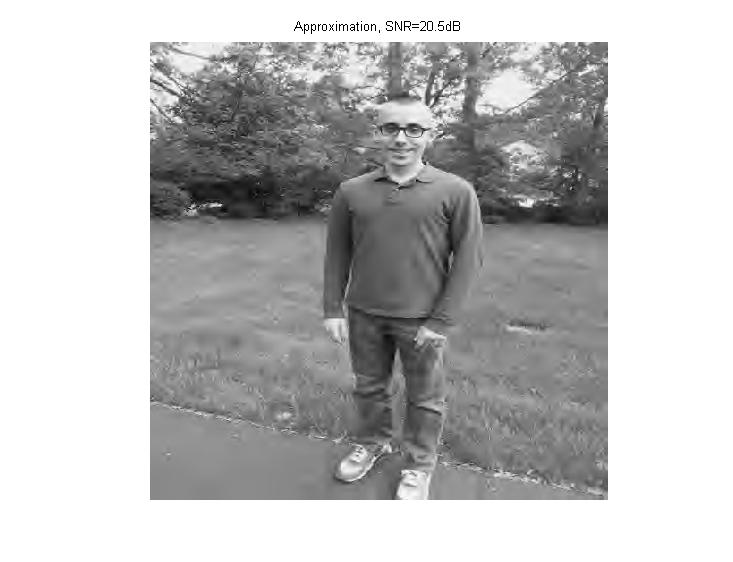
Above is the Non-Linear approximation of my image with T = .2. Lastly, with the help of Mr. Peyre's code, I compare the original picture to the non-linear wavelet compressed version. On his website, Mr. Peyrè mentions how the ringing artifacts are reduced with respect to the Fourier Approximation. (2)
Conclusion
- Home
- Part III: Image Processing with Wavelets
Works Cited
(1) https://www.ceremade.dauphine.fr/~peyre/numerical-tour/tours/introduction_4_fourier_wavelets/
(2) https://www.ceremade.dauphine.fr/~peyre/numerical-tour/tours/introduction_4_fourier_wavelets/
G. Peyré, The Numerical Tours of Signal Processing - Advanced Computational Signal and Image Processing, IEEE Computing in Science and Engineering, vol. 13(4), pp. 94-97, 2011.