Dustin Chu
Professor Slayden
CHEM 350
April 2009
Modeling of
Protein-Small Molecule Complexes
(TFP complexed in 1LIN)
Choosing a protein-hetero
compound complexes
After looking through the options of hetero compounds in the list, trifluoperazine (TFP) was selected. In the Protein Database Bank site, several proteins that complex with the hetero compound were listed as a result of a search with the PDB code. Protein Calmodulin or 1LIN was one of the proteins complexed with hetero compound TFP or 10-[3-(4-methyl-piperazin-1-yl)-propyl]-2- trifluoromethyl-10h-phenothiazine was chosen.
Extracting
the hetero Compound TFP
 Using
DS Visualizer to open the file downloaded from PDB,
in the Hierarchy window, a list of components of the Protein were showed. There
are two chains that named “A” listed, water, protein
residues. After examine the components listed in the hierarchy and the
corresponding highlighted chain on the Graphic window, the water was then
removed. Also there are two chains in the protein, and after going through all the
components in both, the hetero compound was found in the second chain, the
first chain then was deselected. The hetero compound was appeared in 4 areas of
the protein; the one that was located within the protein structure was
selected.
Using
DS Visualizer to open the file downloaded from PDB,
in the Hierarchy window, a list of components of the Protein were showed. There
are two chains that named “A” listed, water, protein
residues. After examine the components listed in the hierarchy and the
corresponding highlighted chain on the Graphic window, the water was then
removed. Also there are two chains in the protein, and after going through all the
components in both, the hetero compound was found in the second chain, the
first chain then was deselected. The hetero compound was appeared in 4 areas of
the protein; the one that was located within the protein structure was
selected.
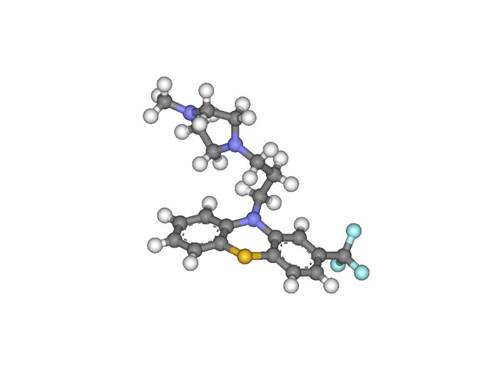
Then, the Hetero compound was copied and opened in another grapic window in DS Visualizer. Once the structure of the hetero compound was showed; it was then compared to the known structure found in the PDB website. The two structures matched each other perfectly. Then the structure was changed from lines to balls and sticks. The structure of the hetero compound TFP was illustrated as showed below:
Figure 1: Trifluoperazine (TFP), complexed with Calmodulin Protein (1LIN)
 And
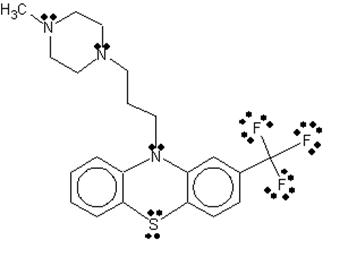
then, a Lewis structure of the hetero compound TFP was drawn using ChemSketch,
showing non-bonded electrons N, S, and F atoms.
And
then, a Lewis structure of the hetero compound TFP was drawn using ChemSketch,
showing non-bonded electrons N, S, and F atoms.
Figure 2: Lewis structure of Hetero Compound TFP complexed in 1LIN Protein.
 Displaying the Protein-Hetero Compound Complex
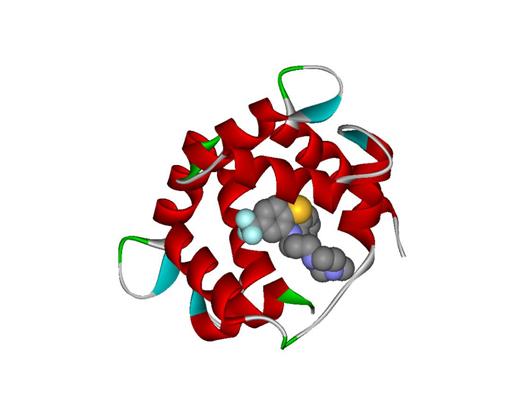
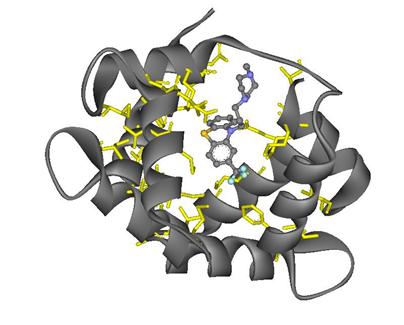
In the same 3D window in DS Visualizer where the protein and the hetero compound was displayed, set None atoms were showed, and Protein was set as Solid Ribbon in the Secondary Type color. The compound was deselected, and set as CPK colors. An image was saved and showed below. From the image, we can see that the hetero compound TFP was located within the 1LIN protein:
Figure 3: 3D image of Hetero compound TFP complexed within the 1LIN Protein
Steric Energy Calculation
The Single Point Energy Calculation for the Hetero Compound TFP extracted from 1LIN Protein are then performed before and after minimization: (kCal/mol)
Table 1: Single Point calculation for Hetero Compound TFP extracted from Protein 1LIN:

The two images below are the structure of the hetero compound before and after minimization. The first one is when it was in higher energy stage when it was complexed with the protein within the protein structure. The second one was when it is in gas phase, at minimum energy.
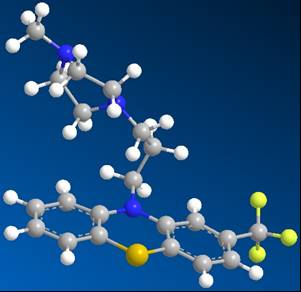
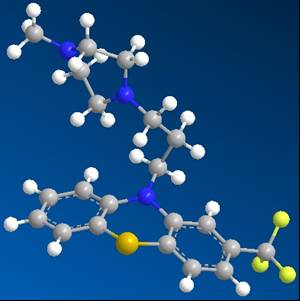
Figure 4 (left): TFP when complexed within Protein 1LIN
Figure 5 (right): TFP structure after minimized energy as in gas phase
First taking a look at these two conformations, they do not look so different, but rather very similar, if not identical. However, when looking at the numbers that have been collected from the calculation using Chem3D, the differences between the two conformations are very clear. The analysis of the steric energy of the two conformations can point out the differences that might not be easily seen through the visual conformations from Chem3D.
First off, the Strech energies of the two conformations are 4 times different (11.68 kCal/mol for Conformation of the hetero compound TFP that was coomplexed with the protein 1LIN, and 2.79 kCal/mol for the conformation in gas phase). As the stretch energy is the energy required for a bond to stretch longer or shorter in the molecule. It is clear that in the minimized energy, the stretch ability of bonds are a lot more free than when the hetero compound TFP is complexed with the protein 1LIN. It is required more energy for a bond to stretch in the protein than in gas phase.
Secondly, the Bond energies from both conformations are very close. The conformation that was complexed in the protein had the bond energy of about 10.9 kCal/mol, where the minimized energy conformation had the bond energy at about 10.6 kCal/mol. This showed that both conformations required the same amount of energy to bend an angle in the structure. The Bond energy refers to the energy required to change a bond angle or bend the angle rather than its optimal stable stage.
The next number to be analyzed was the Strech-bend energy. This energy refers to the energy required to change the stretch ability of two bonds in a compressed bond angle. These numbers from both conformations were very low as of 0.241 kCal/mol for the one complexed with the protein and 1.15 kcal/mol for the gas phase conformation. This energy does not have a large impact on the total steric energy of the two conformations.
Torsion Energy is the energy required to change the torsion angle in bonds. The difference between two conformations in this energy is quite significant. The one that was complexed with protein had a positive number of 11.74 kca/mol, and the gas phase had negative number of -3 kCal/mol. This showed that the while complexed with the protein 1LIN, the hetero compound TFP needed more energy to change a tosion bond angle than in gas phase state.
Non 1,4 Val der Waals energies from the two conformations are different. The hetero compound that was complexed with theprotein had a positive energy while the one in gas phase had negative energy. This can be explained in the similar manner to torsion energy. The Non 1,4 Val der Waals energy refers to any energy that created from the interaction between atoms that are not in the 1,4 position to each other . The energy in the complexed with protein conformation was greater than the energy in the minimized conformation.
1,4 Val der Waals energies between two conformation were both significant to the total steric energy as it was 31.9 kcal/mol for the hetero compound complexed in protein, and 22.8 kcal/mol for the gas phase conformation. This energy reflects the interactions between 2 atoms that are 1,4 position apart or 3 atoms far from each other. In the minimized energy conformation, the 1,4 Val der Waals energy was still very high compared to other factors contribute to the total steric energy. That was mostly the main energy impacted ( 22.8 kcal/mol out of 33.1 kcal/mol)
Lastly, the dipole-dipole energy which is the energy reflected from the interactions of the dipole molecules. In both conformations, the dipole interactions were quite low. In protein, the TFP dipole interactions were just as much as found in the minimized conformation. They were closely to 1 kcal/mol.
As a whole, the total energies between the two conformations are very different. The biggest contributor to the differences in energy was the torsion energy about 20 kcal/mol different, and then the other energies such as Strech, Non 1,4 Val der Waals, and 1,4 Val der Waals energy are next to contribute the differences as about 10-12 kcal/mol each. The Bend, Strech-Bend, and Dipole-Dipole Energy do not effect the difference between the two conformation, even though their values maybe are large or small in respect to the total energy.
Superimposing the
extracted and the energy-minimezed hetero compounds
of TFP
The last part of the project was to perform an overlay for the two conformations. In this part, the two structures were placed in the same Graphic window in Chem3D side by side each other and were rotated so that they were very close in the 3D structure view. The structure of the hetero compound TFP when it was complexed with the protein and the structure in the minimum energy as in gas phase were used to performed an fast overlay. The hydrogen and the non bonded electrons were removed from the models as Chem3D did add the non bonded electrons during minimization. Using Chem3D, one structure was selected (the TFP that was complexed in the protein) and used to be overlaid by the conformation that was minimized the energy as in gas phase. Once fracture 1 was highlighted (set target fragment), the overlay took place. Choosing the other fracture, and then choose to perform a fast overlay. Quickly, the two conformations were placed on top of each other as image below:
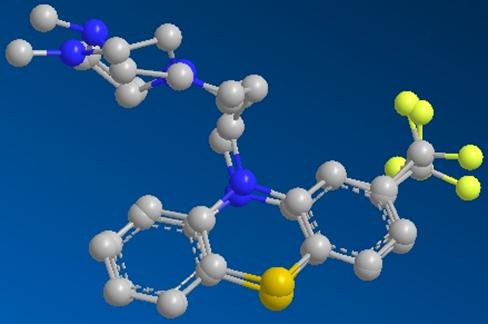
Figure 6: Overlaid of TFP in minimized energy on the TFP complexed in 1LIN
The image showed the differences in the two conformations that might not be seen when the two structures were apart. The benzene rings were overlaid perfectly but the branch contained nitrogen atoms were not fitted on top of each others. There were some differences in the bonds that connected Fl as well. This showed that within the protein structure, the hetero compound TFP was interactive with the surrounding amino acids of the protein. Therefore, there are differences between the conformations when it is free in gas phase.
Another noticeable unmatched was the ring included two nitrogen atoms. The Nitrogen atoms were not overlaid on top of each other but rather laid in different angels. This also explains why the Torsion and the Non 1, 4 Val der Waals energies were different from the two conformations.
Protein-Ligand Interactions
From the PDBsum site, the wiring diagram of the protein 1LIN (secondary structure) shows all the amino acids that interact within the protein and where they interact within the protein. The wiring diagram shows the sequence of the protein and all its alpha helixes and beta sheets and transitions within the protein.
The dots indicate the interactions between the amino acid residues with the ligand. The triangles refer to the amino acids at the protein catalytic active site. The Hetero compound I chose TFP 153 reacts with the amino acids with following numbers: 8, 11, 14, 15, 18, 27, 32, 51m 52, 54, 55, 63, 68, 71, 72, 92, 100, 109, , 114, 115, 116, 120, 124, 127, 136, 144, 145, and 147. The Wiring Diagram of TFP interacts within Protein 1Lin is showed below:

Figure 7: Wiring Diagram of Protein 1LIN
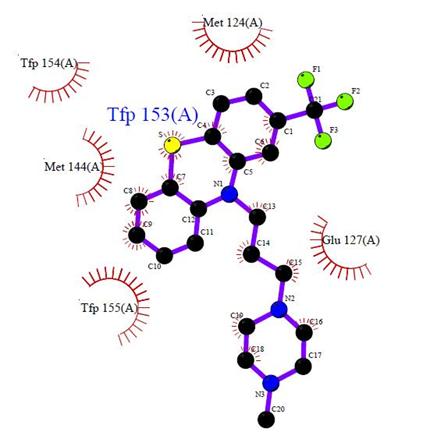 Another
diagram from PDBsum site was used to illustrate the
interactions of the Hetero compound TFP in the Protein 1LIN was the LIGPLOT
diagram. The LIGPLOT diagram shows the
TFP 153 in chain A and the interactions to the few
amino acids from around it within the protein 1LIN. The eyelashes with labels
are the surrounding amino acids of the Hetero Compound TFP in the protein. The
Hetero Compound was showed in balls and sticks style with atom color.
Another
diagram from PDBsum site was used to illustrate the
interactions of the Hetero compound TFP in the Protein 1LIN was the LIGPLOT
diagram. The LIGPLOT diagram shows the
TFP 153 in chain A and the interactions to the few
amino acids from around it within the protein 1LIN. The eyelashes with labels
are the surrounding amino acids of the Hetero Compound TFP in the protein. The
Hetero Compound was showed in balls and sticks style with atom color.
Figure 8: LIGPLOT Diagram of TFP 153 in Protein 1LI
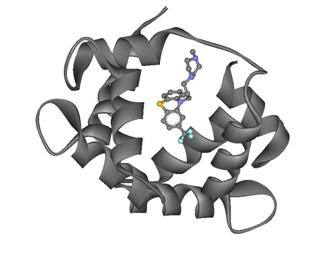
Then DS Visualizer was opened again, The TFP within the Protein 1LIN was then showed in several styles to show the location and the interactions between the hetero compound and the amino acids around it within the protein. This image on the right shows the TFP’s (balls and sticks) location within the protein.
Figure 9: TFP (balls and sticks) within the Protein 1LIN
The image on the left shows the interactions between the TFP and the amino acids in the protein. The interacting amino acid residues are illustrated in yellow, the TFP is in balls and sticks in color coded by atoms, and the protein 1LIN is gray.
Figure 10: Interacting amino acid residues in protein 1LIN
The next image showed below illustrated the interactions between the Hetero Compound TFP and the amino acids surrounding in the Protein 1LIN. The image is when the protein was hidden, this images only shows the interacting amino acid residues and the interaction with the Hetero compound TFP.
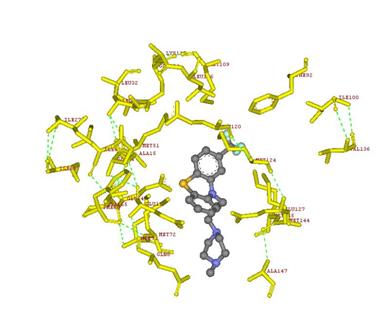
The interacting amino acids residues are showed in yellow and labeled. The green dotted lines dedicated to the Hydrogen bonds between the amino acid residues.
Figure 11: Interactions between TFP and amino acids residues in Protein 1LIN.
The final image shows TFP in ball-and-stick style, the interacting amino acids in yellow color that Hetero Compound TFP reacts with, and the additional amino acids remain in the Protein 1LIN that are showed in gray ribbons. This shows how these amino acids react in the protein and the complete Hetero Compound-Protein Complex interactions around the TFP. Again, the Hydrogen bonds between the amino acid residues are showed in green dotted lines.
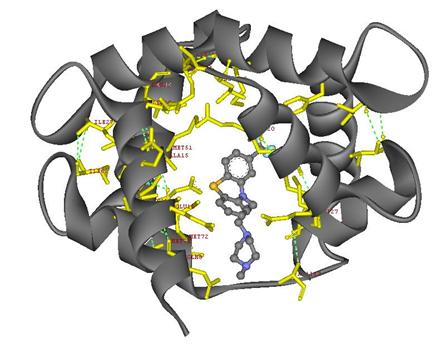
Figure 12:
Final rendering of
the protein1 LIN and hetero compound TFP complex showing the interaction
between the amino acid residues and the hetero compound
Finally the Lewis structure of the compound was converted into number using ChemSketch. The numbering was generated automatically by ChemSketch.
Figure 13: Numbered conformation converted from Lewis structure of Hetero Compound TFP
The interactions of amino acids side groups on a protein backbone are showed on the table below.
Table 2: Interactions of Amino Acid Side Groups on the Protein backbone:
|
Amino Acid Residues |
Hetero Compound Atoms |
Nature of Interactions |
|
|
MET 124, 144 |
Side chain CH3-S-CH2-CH2 |
Sulfur Containing |
Hydrogen bonding. H is Hydrogen-bond donor (HBD) S is hydrogen bond acceptor (HBA) |
|
TFP 154, 155 |
Side Chain-Aromatic rings |
Multi rings |
There may be some interactions between TFP 154 is near atom sulfur from the Hetero Compounds. There also are multi aromatic rings interactions. They might be hydrophobic or stacked with the hetero aromatic ring. |
|
GLU 127 |
Side chain- |
HO- |
Carboxylic acids. Hydrogen is HAD, electrostatic attraction to positive charge. |
Reference
1. PDB ID: 1LIN
Vandonselaar, M., Hickie, R.A., Quail, J.W., Delbaere,
L.T. ![]() (1994)
Trifluoperazine-induced conformational change in Ca(2+)-calmodulin.
(1994)
Trifluoperazine-induced conformational change in Ca(2+)-calmodulin. ![]() Nat.Struct.Biol.
Nat.Struct.Biol. ![]() 1: 795-801
1: 795-801
2. Calcium-binding Protein. PDBsum. May 5, 2009. <http://www.ebi.ac.uk/thornton-srv/databases/cgi-bin/pdbsum/GetPage.pl>
3. Vandonselaar M, Hickie RA, Quail JW, Delbaere LT. “Trifluoperazine-induced conformational change in Ca(2+)-calmodulin”. Nat Struct Biol.
1994 Nov;1(11):795-801. DOI
10.2210/pdb1lin/pdb
4. PBD
website. www.rcsb.org