function histogramEqualization()
I = rgb2gray(imread('landsat.jpg'));
h1 = zeros(1,256);
for i = 1:256
h1(i) = sum(sum(I==i-1));
end
h1 = h1 * 255 / sum(h1);
J = zeros(size(I));
for i = 1:256
J = J + (I==i-1)*round(sum(h1(1:i)));
end
h2 = zeros(1,256);
for i = 1:256
h2(i) = sum(sum(J==i-1));
end
h2 = h2 * 255 / sum(h2);
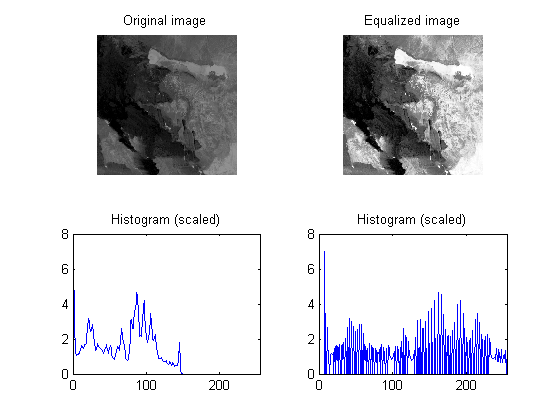
subplot(2,2,1); imshow(I); title('Original image');
subplot(2,2,2); imshow(J, []); title('Equalized image');
subplot(2,2,3); plot(h1); xlim([0,255]); title('Histogram (scaled)');
subplot(2,2,4); plot(h2); xlim([0,255]); title('Histogram (scaled)');
set(gcf, 'color', 'w');
end