Mapping
Census 2000 with ArcView 3.X or ArcGIS
April, 2004
By the government document unit, Fenwick Library, GMU
This exercise is to create several maps using Census 2000 and 1990 data in Fairfax, VA:
Population change (number and %) from 1990 to 2000, Median value for Owner Occupied Housing (1990, 2000 and change) and the Median Year of Housing structure (1990, 2000 and change of Years).
Outcomes of the Exercise.
Students learn how to explore and download Census data from the online Census Web site (www.census.gov) or American Factfinder (factfinder.census.gov); how to create this data in a dbf file, how to join this data to work with ArcView or ArcGIS; how to create thematic maps using ArcView 3.x or ArcGIS.
What you will need: ArcView or ArcGIS desktop, An Internet Browser, Excel, Access, and WinZip (or any unzipping utilty).
1. Downloading Shape files for Fairfax County:
- Visit the ESRI website at www.esri.com
- At the search bar on the top right corner of the page, type ‘Census 2000 Tiger/Line data’.
- Click on the second result which reads “Download Census 2000 TIGER/Line Data”
- Select Virginia (VA) state at the state selection either by clicking on the VA state in the map or by selecting Virginia from the drop down menu.
- Select Fairfax county from the Select by County drop down menu and click on submit selection.
- In the
Available Data Layers section, check the boxes next to the following data
layers:
- Census Tracts 1990
- Census Tracts 2000
- Census Blocks 1990
- Census
Blocks 2000
-
Congressional Districts - 106th
- School
Districts – Unified
- Voting Districts 2000
- Key Geographic Locations
- Then finally click on Proceed to Submit.
- Then click on Download File and save the data in your computer.
- Unzip the downloaded files using Winzip software (or any other unzip utility) and store the data into a folder named ‘fairfaxCT’.
NOTE: When you unzip each of the zipped files, they will in turn give you three files. One file with ‘.shp’ extension, one with ‘.shx’ extension and one with ‘.dbf’ extension.
2.
Downloading the Census data:
- Visit the American Factfinder website at factfinder.census.gov
- Click on Data Sets in the left hand side menu of this website.
- In the 2000 section, select Census 2000 Summary File 1 (SF 1) 100-Percent Data and click on the Detailed Tables. In the select geographic type section, scroll down to Census Tracts in the drop down menu.
- In the select a state section, drop down and select Virginia.
- In the select county section, drop down and select Fairfax County.
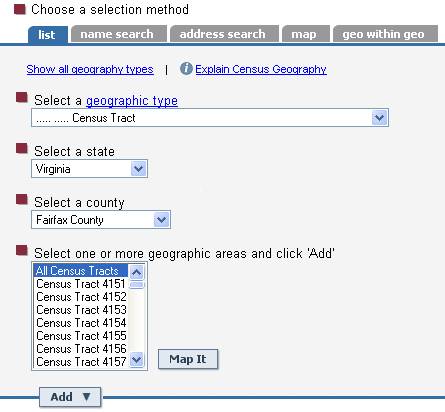
- In the Select one or more geographic areas and click 'Add', select All Census Tracts and click on Add.
- Then click on Next.
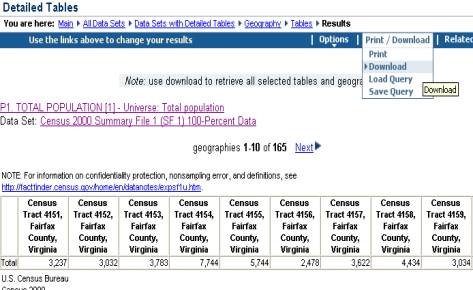
- Then select the P1. Total Population from the list of tables and click on add.
- Then finally click on show result. It gives you summary of the table selected.
- Now in the print/download menu to the top, click on download (as shown in the figure below). It would give you various format options to download in. Uncheck the ‘include descriptive data element names’ box. Select Microsoft Excel (.xls) and click ok. Then save the zipped file to your computer.
- Follow the above steps to also download the following tables.
NOTE: The following files have to be downloaded from the American Factfinder website to complete this exercise.
Year 2000
Census 2000 Summary File 1 (SF 1):
· P1. Total Population
Census 2000 Summary File 3 (SF 3):
· H35. Median Year of Housing Structure
· H85. Median Value for Owner Occupied housing
Year 1990
1990 Summary
Tape File 1 (STF 1) - 100-Percent data
· P001. Total Population
1990 Summary Tape File 3 (STF 3) - 100-Percent data
· H 025A. Median Year of Housing Structure
· H 61A. Median Value
IMPORTANT
The census data that has been downloaded as above gives us excel sheets of information on the total population, median value and median year. Each data set gives us 2 excel sheets with the names ending with ‘geo’ and ‘data1’.
For example, when we download the total population data set
for the year 2000, it would give us 2 excel sheets. One would be named as dt_dec_2000_sf1_u_geoand
the other excel sheet would be named as dt_dec_2000_sf1_u_data.
The file data1 contains the population information in it while the geo information contains the county geographic information such as tracts, etc. We will be joining the above data tables with the Fairfax county shape file on the basis of the geographic information in the form of Tracts. In order to join the population information to the Fairfax county shape file, we need to join the above 2 excel sheets into one file which contains the population information as well as geographic information.
To make things easier, we will also join all the above files into one census data file, which can then be imported into ArcView or ArcGIS for further analysis.
Unzipping the downloaded files:
Unzip all the downloaded census files using Winzip software (or any other unzipping utility) and save them in folder named accordingly. Rename all the excel sheets with the same name as the folder for easy reference.
Example: after unzipping the H35 file, save the contents in a folder named “Med_Year_2000”. Then rename the 2 excel sheets as “Med_Year_2000_data1” and “Med_Year_2000_geo” respectively.
3.
Joining the tables
MS Access database is required to continue with this
exercise!!
Before starting this exercise, make sure that you give appropriate names to the columns containing housing, year and population information in the downloaded Excel sheets.
We have to import all the excel files into the MS Access database in order to join them. We need a relational database (like Access) for us to join the tables relationally keeping a column as reference.
Importing Excel files into Access:
- To import the excel files into MS Access, open the Access database.
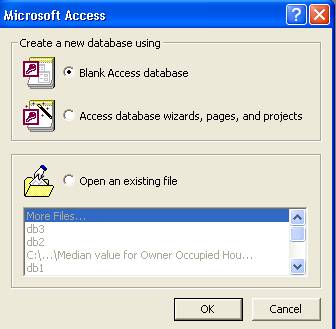
- Click on Blank Access database and click on OK.
- Save ‘db1’ database in a temporary folder and click on create.
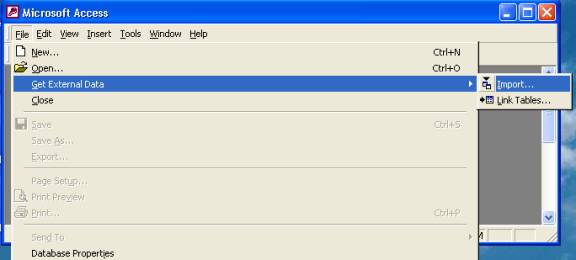
- Then go to File>Get External Data>Import as shown in the figure below.
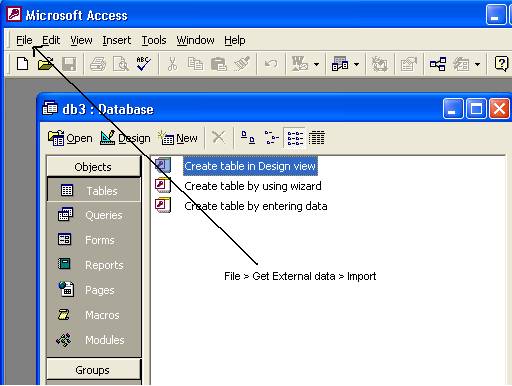
- Scroll to the folder where you stored the excel files and open the excel file.
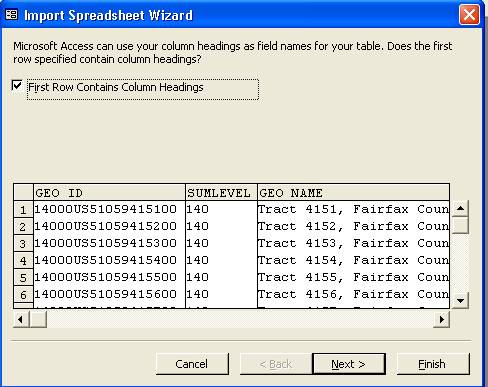
- Access opens up a wizard to import excel files. In the first screen make sure you have the First row contains column headings box checked. Then click next.
- In the ‘where would you like to store data’, Check the ‘in a new table’. Then click next.
- Then in the current screen click on next.
- Then click on No primary key and click next.
- Name the table with the same name as the current excel sheet you are dealing with.
- The wizard finally displays that it has finished importing the excel sheet. Simply click on OK.
- In total, we should have 12 excel sheets imported into Access. Make sure that you import all the excel files downloaded.
Joining the imported files using the Access query builder:
- To join the excel files we use the Access queries. Under the Objects section, click on queries.
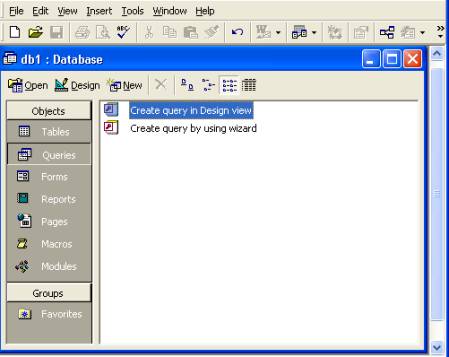
- Then double click on create query in Design View.
- The wizard comes up with a Show Table window with all the imported excel files named in it. Double click on each of those excel sheets to add them to the Select query window. Then click on close in the Show table window.
- The select query window now has 12 windows, each for one excel sheet. Now we have to link a common column in every table to a reference table in order to join them all together.
- We will use the GEO_ID column in the first table window as the reference. In order to link it to every other table window, just drag and drop GEO_ID from the first table to GEO_ID of every table. The link is represented by a black line. Make sure there exists a link between the first table and the remaining 11 tables.
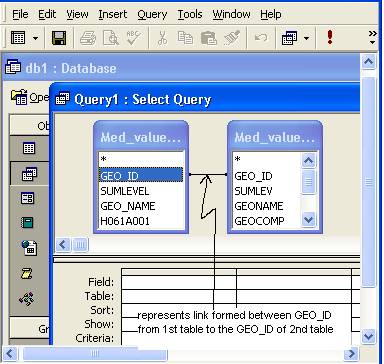
- The figure above shows an example of a link between GEO_ID of first and second table.
- When all the links are formed, we need to add the required columns to the field by dragging and dropping the column names. Each column name goes into a separate section as shown below.
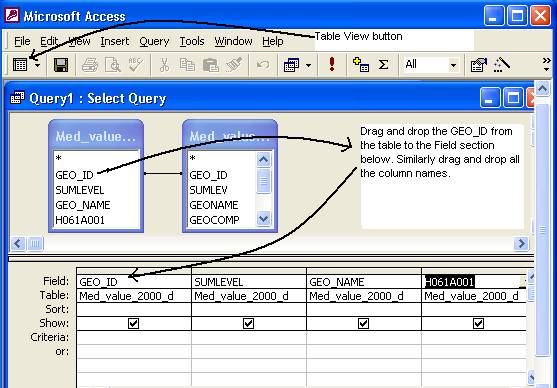
- After adding all the columns, we can view the newly formed table by clicking on the table view bottom at the top left hand corner.
- Now we have to store the newly formed table as a DBF file to enable us to open it in ArcView and ArcGIS. Firstly, save the table (as a query) in your computer using File>Save. Then go to File>Export and save the table as a DBF format. For convenience, we can name the file as “Census_Data.dbf”
Note: Make sure that you save it as DBF IV format, which is ArcView and ArcGIS compatible.
Using ArcView:
This exercise helps you learn how to analyze the census data and create thematic maps on the basis of the census data. The exercise involves importing the DBF file and joining it to the Fairfax county data and also plotting the changes in population, median value and median years from 1990 & 2000.
- To begin the exercise, open ArcView and “select with a new View” option.
- Say yes to “would you like to add data now?” and scroll to the folder where you have stored the Fairfax county shape files. Open the census tracts folder (which is inside the ‘fairfaxCT’ folder) and select the tgr51059trt.shp file, which is the Fairfax county shape file. We have a new view named View1 with the Fairfax County theme added to it.
- Now open the attribute table for this shape file by clicking on the open theme table button.
- Next go to the project window and click on Tables icon on the left hand side. Then click on Add button to open a table.
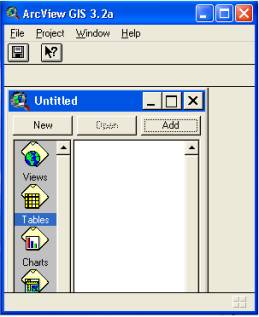
- Browse and open the Census_Data.dbf file. Now we will join the dbf file and the Fairfax county attribute table.
- To join the two tables we will first determine the common field (column) for the join. If you look at the two tables, the Tract column is common to both the tables. For the join, the attribute table for Fairfax County is the destination table and the dbf file is the source table. The figure illustrates the table join settings.
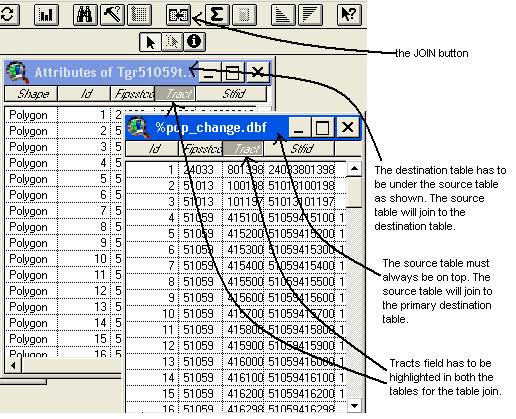
- First,
open the dbf table and click the Tract column name. Then click on the
Tract column name of the attribute table to highlight it. Make sure the
attribute table is on top and click on the join button
 . The dbf file table will automatically close after the
join indicating that the join was successful.
. The dbf file table will automatically close after the
join indicating that the join was successful.
After joining the two tables we have to start analyzing the data in order to come up with meaningful maps based on the census data. The next step would be to calculate the difference in the median values, median years and the changes in population in 1990 & 2000. We have to create new fields for the difference values so that we can plot them in the map.
- To add a field to the table, go to Table>Start Editing. You will notice that the column names that were initially italic are now straight. Then go to Edit>Add Field. Give an appropriate name for the field. For the decimal places field, make sure that you enter the value 5 for it to calculate up to five decimal places.
- Now
with the new field name highlighted, click on the calculate
 button. This
comes up with a window to calculate the values for the newly formed field.
button. This
comes up with a window to calculate the values for the newly formed field.
- In the window, form the following equations:
Note: We need to calculate the percentage changes in population, percentage changes in median value and percentage changes in median year each in a different field.
- For the percentage changes in population from 1990 to 2000
([Tot_Pop_2000]-[Tot_Pop_1990]/ [Tot_Pop_2000])*100
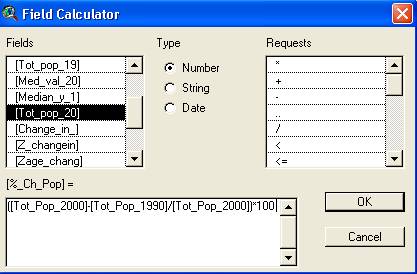
In the above example, we have formed an equation to calculate the percent change in population (%_Ch_Pop). Similarly, we have to calculate the value for the following two fields.
o For the percentage changes in the median value for owner occupied housing
([Med_val_2000]-[Med_val_1990]/[Med_val_2000])*100
o For the percentage changes in the median year of housing structure
([Med_yr_2000]-[Med_yr_1990]/[Med_yr_2000])*100
- After calculating all the fields, make sure that you stop editing by going to File>Stop Editing. When it prompts you to save edits click yes.
- To plot the calculated fields as maps, go to the project window and double click on view1.
- In order to be able to view all the 3 changes, we will make copies of the theme. Highlight the current theme tgr51059trt.shp (the selected theme is slightly raised to indicate that it is highlighted). Go to Edit>Copy Themes to copy the theme. Then paste the theme twice by selecting Edit>Paste themes.
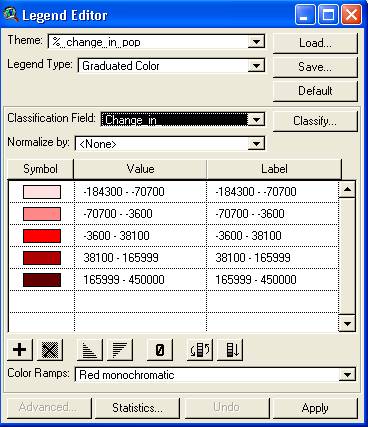
- Now highlight the first of the 3 themes and select Theme>Properties. In the theme name section, rename it as %_change_in_pop. Then click on OK.
- Then double click on this theme to view the legend editor. In the legend editor, select graduated color from the Legend Type field.
- Then in the classification field, scroll down and select the %_Ch_Pop field.
- You could then choose a suitable color ramp from the color ramps section and then click on Apply.
- Check the box right next to the theme to display the percentage changes in population from 1990 and 2000.
Repeat the above last 5 steps to display the changes in median value and median year by selecting the appropriate fields and color ramps. You can save this project by going to File>Save. The ArcView projects are saved as ‘.apr’ extensions.
Using ArcGIS:
The above exercise can also be performed using ArcGIS. The steps to be followed are basically similar. First you have to join the two tables, then build new fields and finally plot the new fields. Lets look at each part stepwise.
- Open ArcMap and select the new empty map option. Then go to File>Add Data and browse to ‘fairfaxCT’ shape file folder and add the tgr51059trt.shp file. Then similarly also add the dbf file formed by the MS Access database.
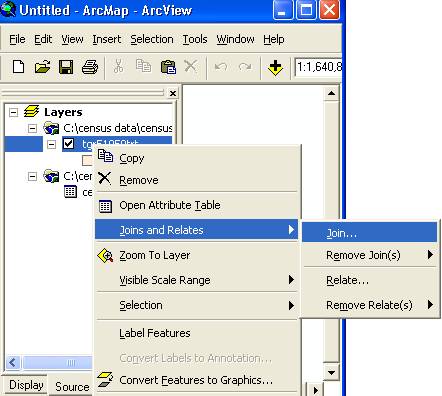
- Now we have to join the attribute table of the Fairfax County shape file and the dbf file table. To do so, right click on the tgr51059trt.shp theme under Layers section and go to Joins and relates and then go to join.
- This will give you a join data window. In the what do you want to join to this layer? Section scroll down to Join attributes from a table.
- In the choose the field in this layer that the join will be based on section scroll down and select the Tracts field.
- The next section automatically gives you the name of the dbf file. In the next section scroll down to choose the Tracts field.
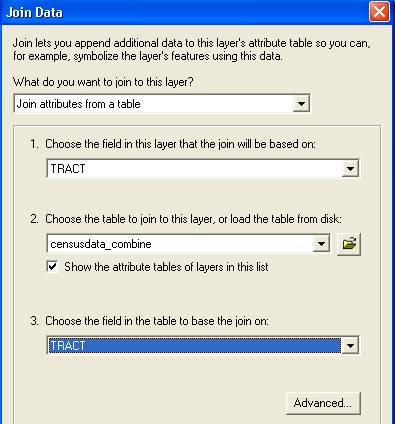
- This will join the two tables.
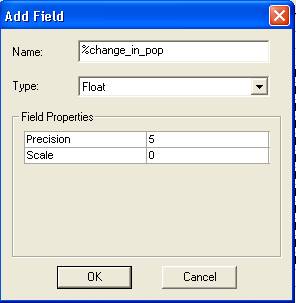
- Now to create new fields in the newly formed table, right click on the theme and click on open attribute table. This opens the attribute table. Now click on the options button at the bottom of the table and select add field. Name the field appropriately and make sure the type is selected as float and that 5 decimal places are chosen in the precision section (as shown in the figure below).
- Now right click on the field name and select calculate values.
- This lets you calculate the values of the field like you did in ArcView. Use the same equations as before to calculate the 3 differences in population, median value and median year.
- Once you are done calculating the fields close the attribute table.
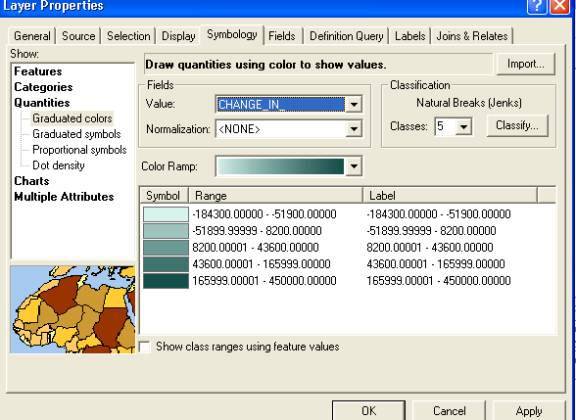
- Now when you double click on the theme file, it gives you the legend editor for that particular theme file. Click on the general tab and rename it appropriately in the Layer name field. Then click on the Symbology tab. In the Show section click on Quantities and then Graduated colors. Then in the Value field, scroll down to the respective field (like percentage population change, etc.) and in the color ramp section select the appropriate color ramp. Then finally click on Apply.
- You can save the projects in ArcMap as ArcMap documents with ‘.mxd’ extension.
If you have any question on this handout, please contact Joy Suh, government documents librarian at George Mason University, at hsuh1@gmu.edu.