Some Immigration Statistics

Barry A. Klinger, December 2017

High resolution version of figure

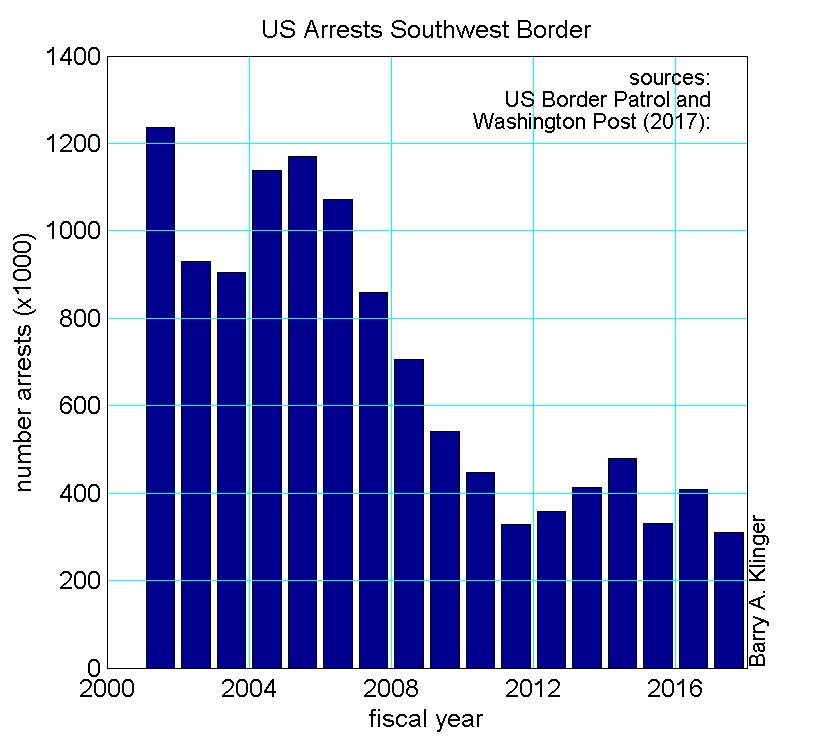
The Washington Post had an article headlined "Arrests Along Mexican Border Drop Sharply Under Trump". What the article did not make clear is that, according to the US Border Patrol statistics cited by the article, arrests for FY 2017 are close to the 2015 number. From 2011 to 2016, arrests ranged from a high of 479 thousand down to a low of 328 thousand, just 5% bigger than FY 2017. Arrests under Obama, in contrast, were less than half the peak during the Bush years. The article gives the impression that there is a larger change from past years than there in fact has been. [Bar for given year is immediately to right of year printed on axis]

Statistics Prior to FY 2017

Distribution of Foreign-Born US Residents

Here is an estimate of the distribution, in the year 2000 of regions from which US residents were born. The 12 million or so foreign-born compares to US population of 282 million that year.

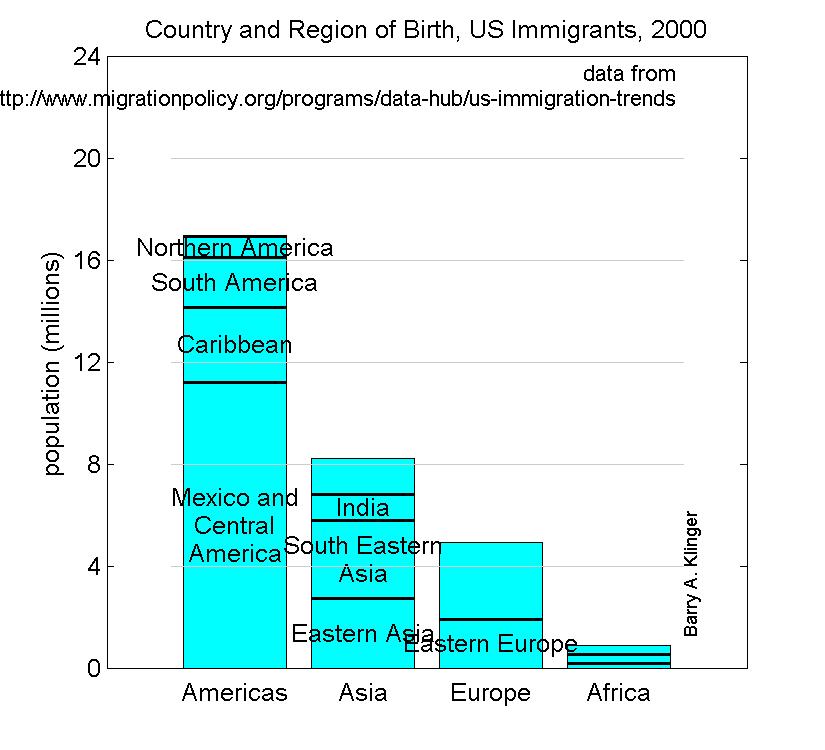
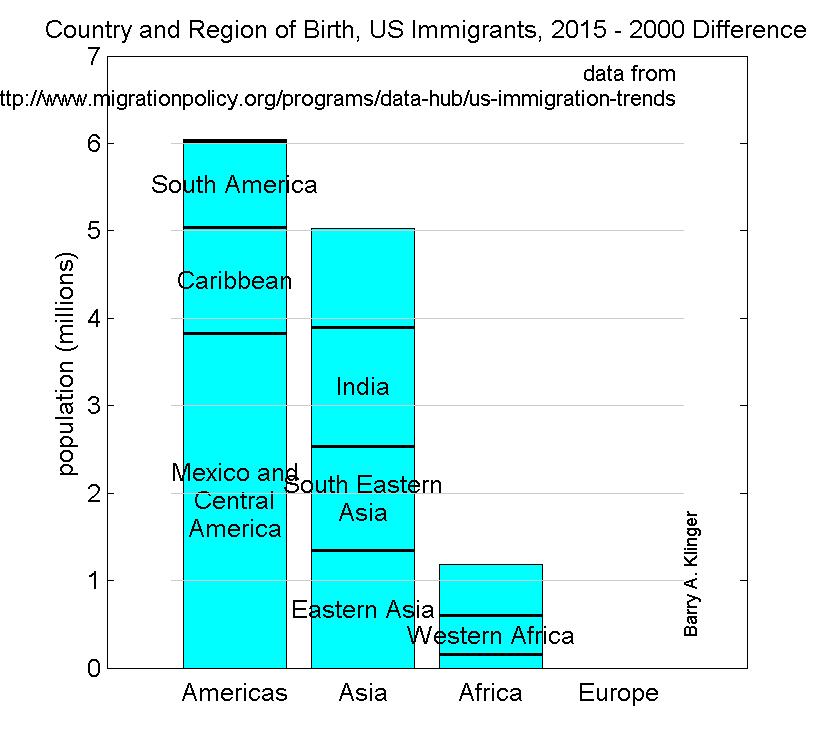
Here is the change in the distribution from year 2000 to year 2015, when total US population was 321 million.

High resolution version of figure 1; High resolution version of figure 2

Some commonly expressed fears about immigration concern its influence on the culture and politics of the country. To the extent that the mostly Spanish-speaking immigrants from the Americas may form a language-block in the US, it is worth noting that the total growth in their numbers over 15 years is 2% of US population. Similarly, immigrants from predominantly Muslim countries in west Asia (unlabeled block in "Asia" stack) number about one million people, or .3% of the US population.
Return to A New Way to Picture Economies and Other National Attributes
Page Created: 5 November 2017.