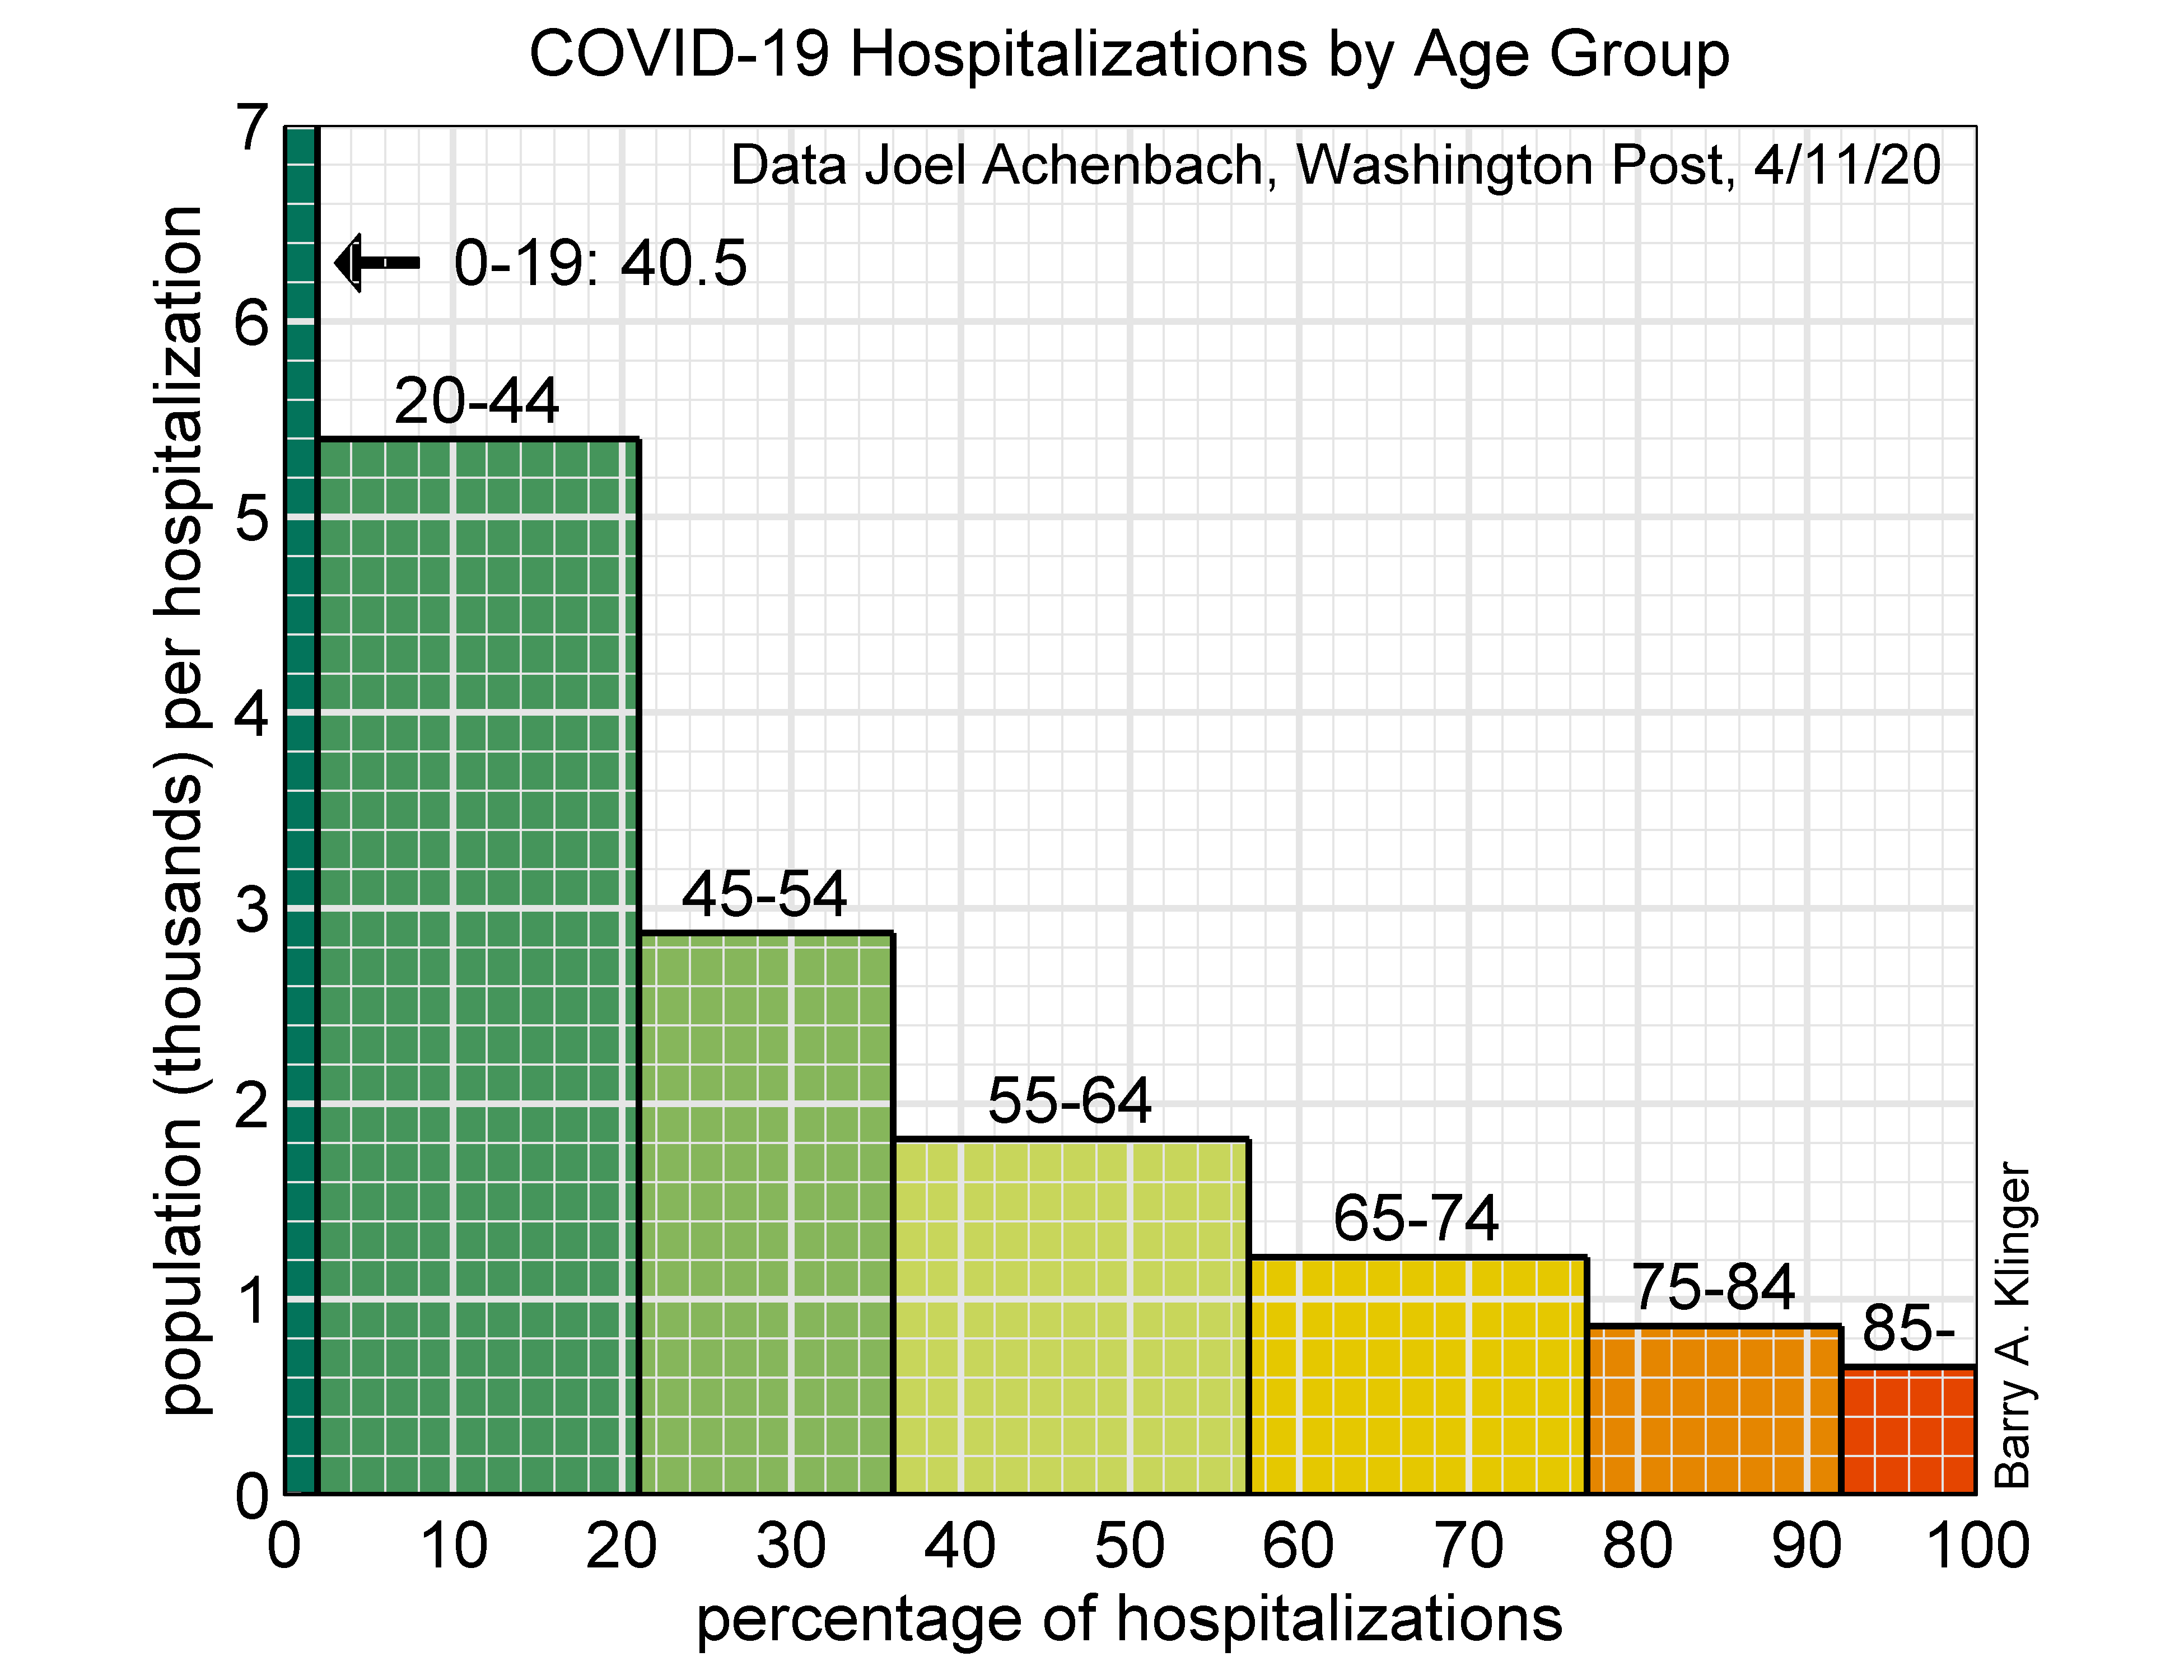
One way to tally the effect of COVID-19 is to count confirmed cases. This statistic depends strongly on how people are selected for testing, which can vary by location, demographic group, etc. Another way is to count hospitalizations, which may be a more uniform measure of serious cases. The Washington Post reported on hospitalization data from CarePort Health's database of medical records. The article shows the fraction of all the hospitalizations that fall into each of seven age groups. However, a more relevant statistic to many people is the chance of members of a particular age group being hospitalized. The chart below shows this statistic.
Each box in the chart represents cases for a specific age group. The width of the box tells the percentage of all recorded hospitalizations that fall into that age group. The height of each box measures the infrequency of hospitalizations: how many people in that age group there are for each person who is hospitalized. The bigger the infrequency, the safer the group is.
Incidentally, the area of each box is proportional to
(number of hospitalizations) x (population per hospitalization) = population.
So the area of each box is a measure of the total number of people in each age group.
The chart clearly shows that each age group has a bigger chance of hospitalization than younger groups. Even though the number of hospitalizations of the 85+ group (as measured by the width of their box) is smaller than several others, they have the biggest probability of hospitalization: one out of about 650. The odds are 2.8 times better for ages 55-64, who in turn have 3 times the chance of ages 20-44. On the other hand, even for the youngest group of adults, the odds of being hospitalized are not negligible compared to older groups.
To calculate the infrequency, we need the number of hospitalizations, and the total population, in that age group. The number of hospitalizations reported in the article, 6479, must be an underestimate, because the latest CDC figures show 18559 deaths in the US, and there are many hospitalizations for each death. The hospitalization data also gives mortality numbers which can be used to calculate a total of 1122 deaths in the sample. In order to scale up the hospitalization data to the entire country, I multiply by (CDC deaths)/(CarePort deaths), which gives a total of 107,000. The fraction of the total population in each age group comes from US Census data for 2013, and to get the total population in each age group, this is combined with the current US population, which is about 330 million.
[13 Apr revision: original version of article showed population/hospitalization numbers that were 10 times greater, due to a programming error. The current version has corrected the numbers.]
Last modified: 13 Apr 2020.