 gb=0.1275 mS, Dfract=2.4080
|
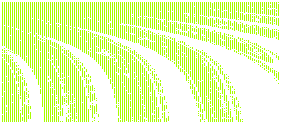 gb=0.1319 mS, Dfract=2.6335
|
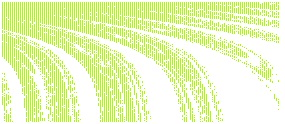 gb=0.1341 mS, Dfract=2.8027
|
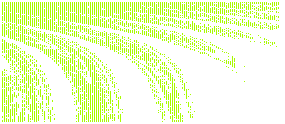 gb=0.1372 mS, Dfract=2.8861
|
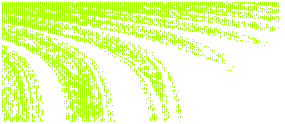 gb=0.1385 mS, Dfract=2.9156
|
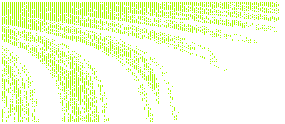 gb=0.1391 mS, Dfract=2.9083
|
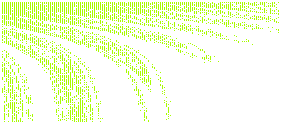 gb=0.1398 mS, Dfract=2.9439
|
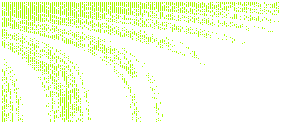 gb=0.1411 mS, Dfract=2.8681
|
 gb=0.1437 mS, Dfract=2.9503
|
 gb=0.1463 mS, Dfract=2.8093
|
 gb=0.1502 mS, Dfract=2.2963
|