|
| Measure | Training | Validation | Definition |
|---|---|---|---|
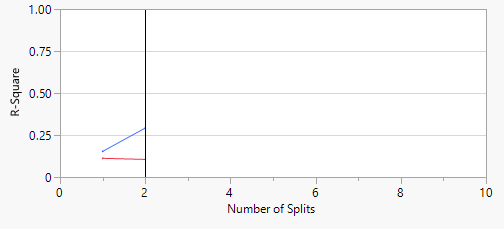
| Entropy RSquare | 0.2926 | 0.1055 | 1-Loglike(model)/Loglike(0) |
| Generalized RSquare | 0.4435 | 0.1810 | (1-(L(0)/L(model))^(2/n))/(1-L(0)^(2/n)) |
| Mean -Log p | 0.4870 | 0.6171 | ∑ -Log(ρ[j])/n |
| RASE | 0.3972 | 0.4521 | √ ∑(y[j]-ρ[j])²/n |
| Mean Abs Dev | 0.3227 | 0.3732 | ∑ |y[j]-ρ[j]|/n |
| Misclassification Rate | 0.2043 | 0.2703 | ∑ (ρ[j]≠ρMax)/n |
| N | 93 | 37 | n |
Training
|
Validation
|
||||||||||||||||||||||||
|
|
||||||||||||||||||||||||
| Term | Number of Splits | G^2 | Portion | |
|---|---|---|---|---|
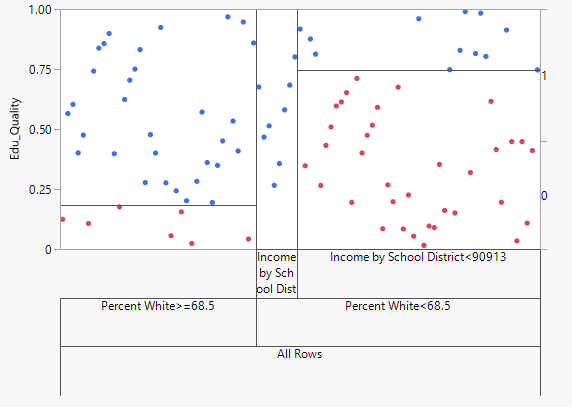
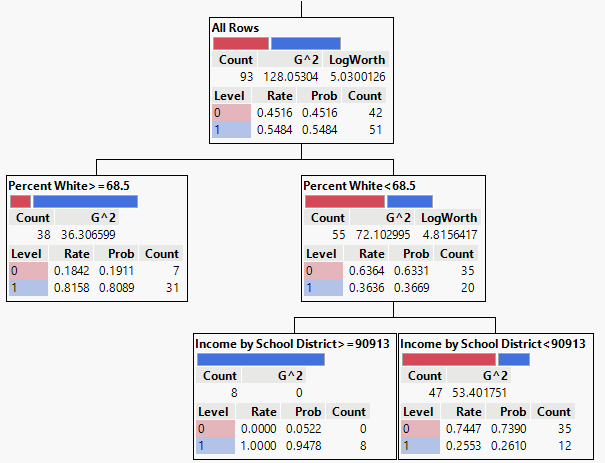
| Percent White | 1 | 19.6434487 | 0.5123 | |
| Income by School District | 1 | 18.7012445 | 0.4877 | |
| Total Number Students | 0 | 0 | 0.0000 | |
| Percent African American | 0 | 0 | 0.0000 | |
| Percent American Indian | 0 | 0 | 0.0000 | |
| Percent Asian | 0 | 0 | 0.0000 | |
| Percent Hispanic | 0 | 0 | 0.0000 | |
| Percent Pacific Islander | 0 | 0 | 0.0000 | |
| Percent Two or More Races | 0 | 0 | 0.0000 | |
| Student/Teacher Ratio | 0 | 0 | 0.0000 | |
| Number Full-time Teachers | 0 | 0 | 0.0000 | |
| Is Title I % | 0 | 0 | 0.0000 | |
| Is Charter % | 0 | 0 | 0.0000 | |
| Is Magnet % | 0 | 0 | 0.0000 | |
| Is Virtual % | 0 | 0 | 0.0000 | |
| Expenditures for Public Elementary and Secondary Schools per Pupil | 0 | 0 | 0.0000 |
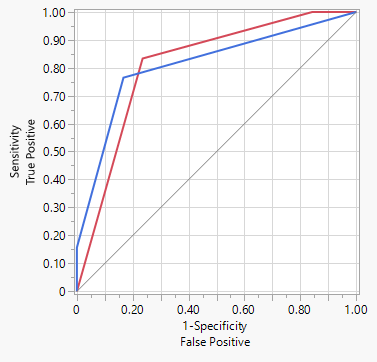
Receiver Operating Characteristic on Training Data
|
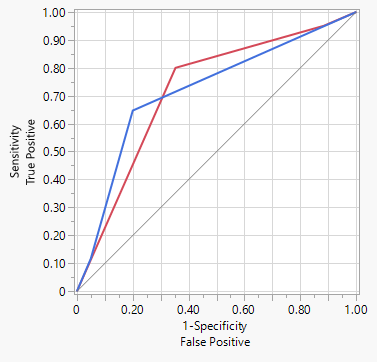
Receiver Operating Characteristic on Validation Data
|
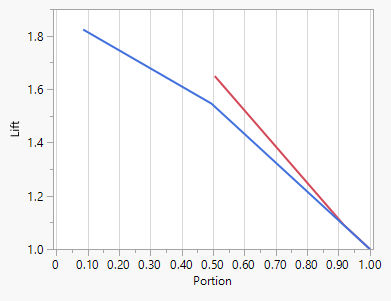
Lift Curve on Training Data
|
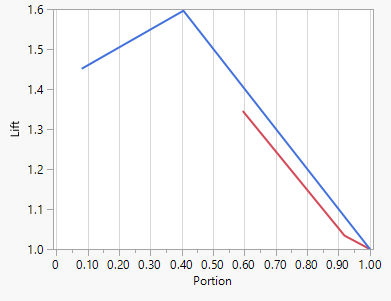
Lift Curve on Validation Data
|
| Leaf Label | 0 | 1 | ||
|---|---|---|---|---|
| Percent White<68.5&Income by School District>=90913 | 0.0522 | 0.9478 | ||
| Percent White>=68.5 | 0.1911 | 0.8089 | ||
| Percent White<68.5&Income by School District<90913 | 0.7390 | 0.2610 |
| Leaf Label | 0 | 1 | ||
|---|---|---|---|---|
| Percent White>=68.5 | 7 | 31 | ||
| Percent White<68.5&Income by School District>=90913 | 0 | 8 | ||
| Percent White<68.5&Income by School District<90913 | 35 | 12 |