R Cluster GUI Beta Preview
Created by Todd Gillette and Mark Coletti at George Mason University.
Contact: tgillett <at> gmu <dot> edu (Todd Gillette)
The purpose of this tool is to integrate cluster methods, exploration via metadata-based data subsets, and visualization
of data and clusters in a user friendly interface. We hope that such a tool will facilitate exploration and intuition building in any type of data. One particular advantage to the tool is that it provides for input of distance matrix data, which many tools do not. This could be of particular benefit given some pairwise comparison for which a feature vector representation is not meaningful or possible. Here you can see a basic view of what the current version looks like and what it does.
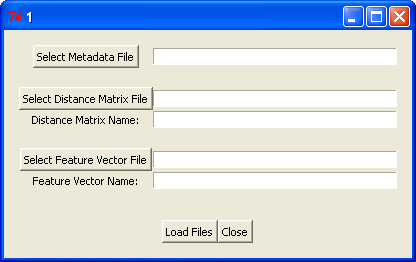
Prompt for selecting a metadata file and either a distance matrix file or a feature vector file.
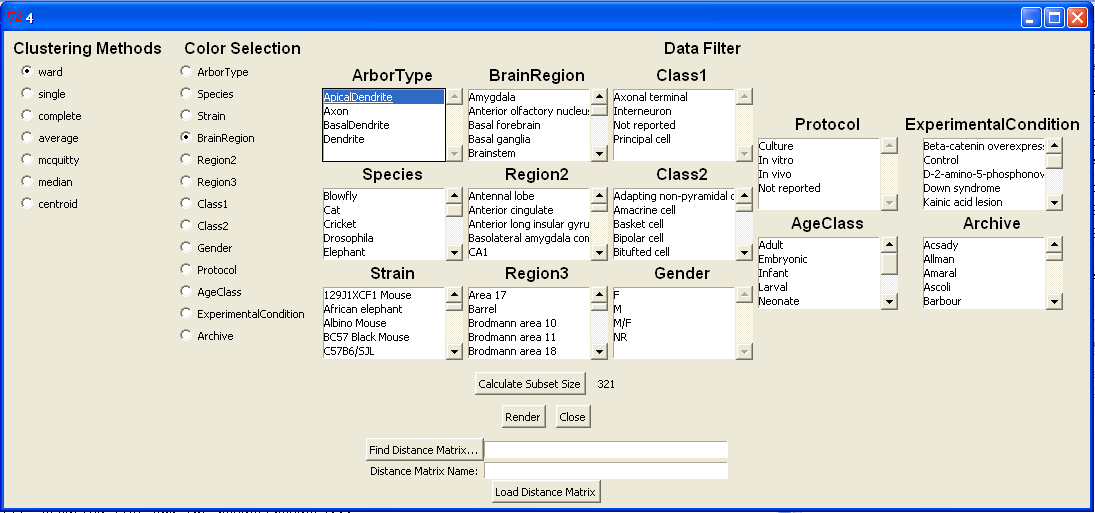
Interface for choosing a cluster method, meta type for visualization ("Color Selection"), and metadata on which to filter.
Also includes option to load additional distance matrices (one at a time), and a read-out for the number of items that pass the data filter.
Metadata in this example is of neurons from NeuroMorpho.Org.
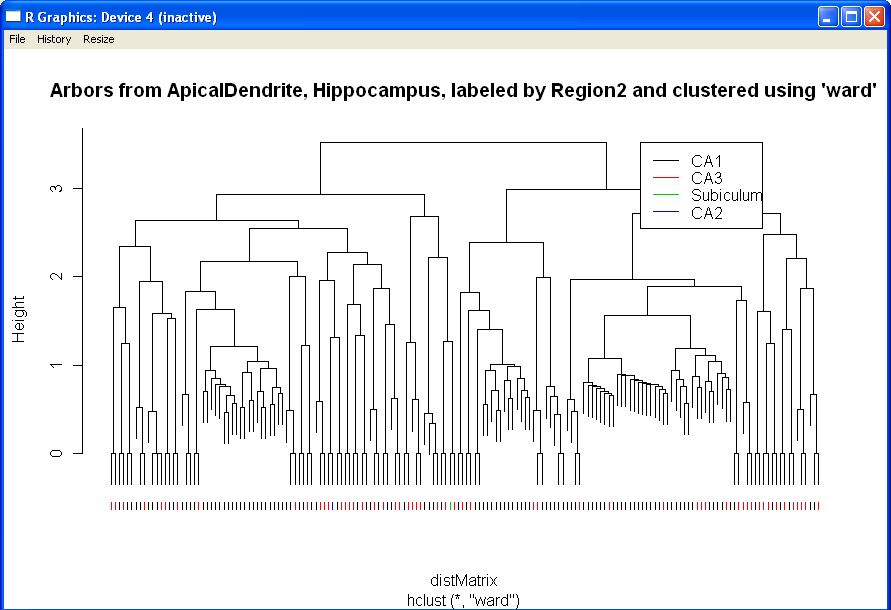
Dendrogram of items determined by the data filter, color coded by the selected metadata type for visual validation.
The current version is preliminary. I hope to get feedback and the benefit of other perspectives as it is others in the community that may benefit from the R Cluster GUI tool. Here are a number of enhancements that I believe would make this tool far more useful:
- Feature vector input (already in progress)
- Numerical ranges for filtering by numerical metadata types
- Spatial visualizations based on feature vector input, principal components, and multidimensional scaling of distance matrix input
- Cluster statistics - external validation (e.g. Rand index, Jaccard Coefficent), internal validation (e.g. Davies-Bouldin index, Dunn index)
- Multiple random subsamples of data to limit time needed to cluster large datasets and produce a representative sample of cluster statistics (i.e. mean, median values)
- A cleaner interface with multiple tabs to facilitate all of the extended functionality