The Simple and Fractional Distillation experiment is conducted to compare the efficiencies of simple and fractional distillations in separating ethyl acetate and butyl acetate in a mixture of the two compounds. The mole percent of each component is to be estimated from graphs of distillate volume vs. temperature for each distillation. In a separate experiment, you will check the results of your analysis by gas chromatography.
The report consists of three parts: the Report Form (from the Manual) and calculations; the graphs; and answers to questions about your results.
Be sure to read and follow the instructions for writing this report, below.
1.) The first page of the Report Form is the raw data from each of the two distillations that is in your notebook. Please fill it out neatly and in ink.
The second page can only be filled out after you complete the graphs and analyze the data, as explained below.
2.) Use a spreadsheet program to enter your data and to prepare graphs from your distillation. There are two data sets and thus two separate graphs: one for simple and one for fractional distillation.
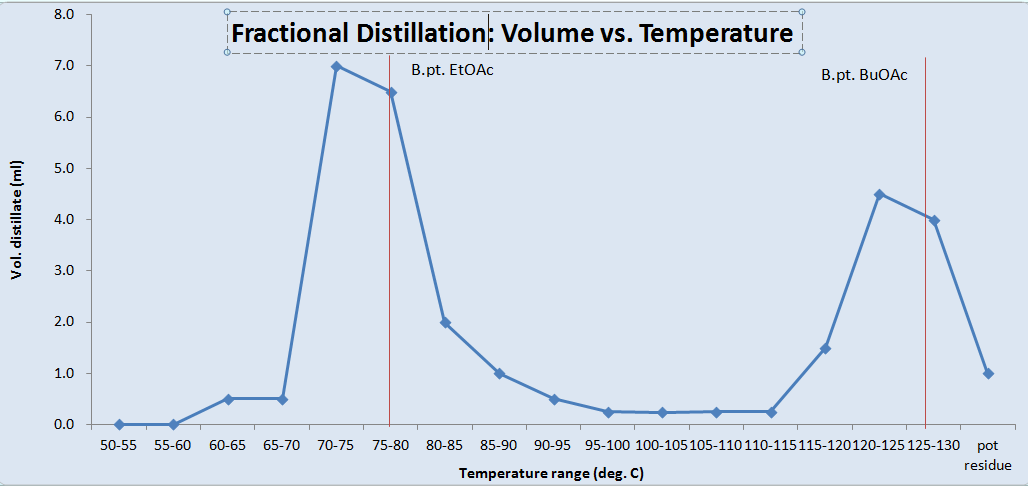
Prepare line graphs (not a scatter graph) for each of the distillations - one graph per page. Follow rules of good graphing: the plot should fill most of one page; there should be an informative title; the axes should be labeled. Begin your temperature axis at about 5-10 degrees prior to the actual distillation temperature (do not begin at room temperature -- why not?). Since this is a line graph, you can show the temperature ranges and the "pot residue" label on the x axis. The volume axis should begin at 0 and volumes should be shown to one decimal place. On each graph, place a labeled vertical line corresponding to the literature boiling temperature for ethyl acetate and for butyl acetate. Please see an example, below, for fractional distillation.
Note: If you collected some distillate over some irregular temperature intervals (<5 deg. or > 5 deg.), please write correction notes directly on your printed graph. It is not easy to put these non-regular intervals in a line graph.
Look closely at the graph from the Vigreux fractional distillation. You should be able to tell fairly clearly the areas of the graph that correspond to (mostly) ethyl acetate distilling and to (mostly) butyl acetate distilling since you know their respective boiling points.You will have to make some assumptions about the composition of the volumes that are a mixture of the two components (you will explain the assumptions in the answers section, below). On the graph itself, clearly designate which volume areas you will use for the calculation of % ethyl acetate, which areas you will use for the calculation of % butyl acetate, and which area is amixture of the two. The pot residue (which would have distilled if you had let it), must be included.
Repeat this analysis for the simple distillation. The areas of the graph of the simple distillation may not be as clear as for the fractional distillation. A visual comparison of the two graphs should clearly demonstrate the difference in efficiency of the two methods.
All distillation fractions must be designated as EtOAc, BuOAc, or mixture. These same volumes will be entered on page two of the Report Form and used for the calculations, below.
Keep a copy of your graphs for the next experiment.
Assumptions and Calculations
Before you finish the calculations, you must explicitly state your assumptions regarding the composition of the distillate fractions for each distillation method. In order that your answers can be more easily read, please submit these answers as a typed print copy. Use 1-inch margins, 12-pt font, and double-spaced, printed on only one side of the page. If you find yourself with more than 1 page, it is too long. Retain the numbers/letters to these statements on your answer page.
3.) a. With reference to each of your marked graphs in 2.), above, explicitly state which volumes you have chosen as mostly pure ethyl acetate and which volumes are mostly pure butyl acetate and why you have chosen these volumes.
b. There is likely to be some distillate in the areas between the two mostly pure areas that is a mixture of the two (and it is designated as such on your graphs). Explicitly state which volumes are likely a mixture of the two. What percentage of the mixture volume is likely to be EtOAc and BuOAc? Explain your reasoning. Note: there is no one correct answer to this question. You make a reasonable assumption and explain your reasoning. (You might apportion the percentages differently in the simple and fractional distillations, depending on the results from the graphs.) Note: simply dividing the mixture in two in order to avoid making this assumption is a wrong answer. The final volume percentages for the two acetate components must equal 100% of the volume recovered (remember, pot residue is considered "recovered").
c. Explain what is meant by "efficiency" with respect to a distillation. How do you compare the relative efficiencies of the two types of distillation your team performed? Explicitly compare the mole percentages of the components calculated for each distillation method.
d. If something went awry with a distillation, this would be the place to briefly explain it so that your instructor can interpret your results accordingly. For example, if you have a very poor separation in the fractional distillation, or no separation in the simple distillation, this needs to be explained.
4.) The calculations should be done in your notebook on pages that are a continuation of the Distillation experiment (and so properly titled and dated). Turn in the copy as part of your report and keep the original in your notebook. All calculations should be shown neatly and clearly labeled. Pay attention to significant digits.
You should now be able to calculate the volume percent of each of the two components in the unknown mixture for each of the distillations.
After you have determined the volume percent composition, you can convert to mole percent composition (using literature values for density and molecular weight), a more useful quantity. Use volumes for this calculation, not volume %. Record the results of these calculations on the second page of the report form.
Assemble and staple your report in this order: report form, graphs, notebook calculations, written answers.
You will be graded on your adherence to these instructions.