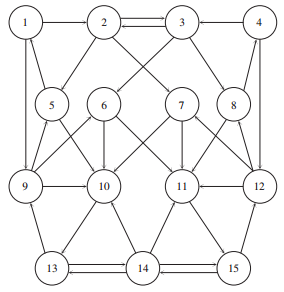
This project was meant to explore how Google generates their search results on the basis of ranking pages based on how many other pages reference them. To do this, they create an adjacency matrix, which has a column for each page in the network, and each row corresponds to how which other page references that page within the network. I.e. for an \(n \times n\) matrix, an \(ij\) entry of 1 means there is a link from node \(i\) to node \(j\). So the probability that a user will click a link from page \(i\) to page \(j\) is given by: \begin{align*} q/n + (1-q)A_{ij}/n_i \end{align*} where \(A_{ij}\) is the entry of the adjacency matrix and \(n_i\) is the sum of \(i\)th row of \(A\). The \(q\) term gives the probability that the user will go to a random page. So for the given network:
our \(A\) matrix is given by: \begin{align} \left[ {\begin{array}{ccccccccccccccc} 0 & 1 & 0 & 0 & 0 & 0 & 0 & 0 & 1 & 0 & 0 & 0 & 0 & 0 & 0 \\ 0 & 0 & 1 & 0 & 1 & 0 & 1 & 0 & 0 & 0 & 0 & 0 & 0 & 0 & 0 \\ 0 & 1 & 0 & 0 & 0 & 1 & 0 & 1 & 0 & 0 & 0 & 0 & 0 & 0 & 0 \\ 0 & 0 & 1 & 0 & 0 & 0 & 0 & 0 & 0 & 0 & 0 & 1 & 0 & 0 & 0 \\ 1 & 0 & 0 & 0 & 0 & 0 & 0 & 0 & 0 & 1 & 0 & 0 & 0 & 0 & 0 \\ 0 & 0 & 0 & 0 & 0 & 0 & 0 & 0 & 0 & 1 & 1 & 0 & 0 & 0 & 0 \\ 0 & 0 & 0 & 0 & 0 & 0 & 0 & 0 & 0 & 1 & 1 & 0 & 0 & 0 & 0 \\ 0 & 0 & 0 & 1 & 0 & 0 & 0 & 0 & 0 & 0 & 1 & 0 & 0 & 0 & 0 \\ 0 & 0 & 0 & 0 & 1 & 1 & 0 & 0 & 0 & 1 & 0 & 0 & 0 & 0 & 0 \\ 0 & 0 & 0 & 0 & 0 & 0 & 0 & 0 & 0 & 0 & 0 & 0 & 1 & 0 & 0 \\ 0 & 0 & 0 & 0 & 0 & 0 & 0 & 0 & 0 & 0 & 0 & 0 & 0 & 0 & 1 \\ 0 & 0 & 0 & 0 & 0 & 0 & 1 & 1 & 0 & 0 & 1 & 0 & 0 & 0 & 0 \\ 0 & 0 & 0 & 0 & 0 & 0 & 0 & 0 & 1 & 0 & 0 & 0 & 0 & 1 & 0 \\ 0 & 0 & 0 & 0 & 0 & 0 & 0 & 0 & 0 & 1 & 1 & 0 & 1 & 0 & 1 \\ 0 & 0 & 0 & 0 & 0 & 0 & 0 & 0 & 0 & 0 & 0 & 1 & 0 & 1 & 0 \\ \end{array} } \right] \end{align}
The probability of ending up on a given page is equivalent in matrix
terms to the eigenvalue equation
\begin{align}
p=Gp \\
\end{align}
where \(p=(p_i)\) is the vector of \(n\) probabilities of being at the \(n\) pages, and
\(G\) is the matrix whose \(ij\) entry is \(q/n + A_{ji}(1-q)/n_j\). We will call \(G\) the
Google Matrix, and in the first part of the project we were asked to prove that the Google
Matrix was stochastic, i.e. each of the columns sum to 1, which also means that the largest
eigenvalue is equal to one. Since each column corresponds to a probability distribution,
each column necessarily sums to one and is therefore stochastic. We were then asked to
construct the \(G\) matrix for the given network and verify the given dominant eigenvector
\(p\). To do this, we created the scripts:
Gmatrix.m ,
problem1.m ,
and problem2.m .
These gave us the principle eigenvector of the Google Matrix corresponding to the dominant
eigenvalue of 1 of:
\[ P=\left( \begin{array}{ccccccccccccccc}
0.0268 \\
0.0299 \\
0.0299 \\
0.0268 \\
0.0396 \\
0.0396 \\
0.0396 \\
0.0396 \\
0.0746 \\
0.1063 \\
0.1063 \\
0.0746 \\
0.1251 \\
0.1163 \\
0.1251 \\
\end{array} \right)
%
\left( \begin{array}{cc}
7 \\
6 \\
6 \\
7 \\
5 \\
5 \\
5 \\
5 \\
4 \\
3 \\
3 \\
4 \\
1 \\
2 \\
1 \\
\end{array} \right)
=Rank
\]
As described in the overview, the parameter q is the probability that a user selects a random page from the internet. The affect of this parameter is shown below with three different values of q= 0, .15, and .50. As expected, the higher level of q, the less important the links are as users are more likely to go to random pages. When q=0, the probabilites of being on a page directly correspond with the amount of links which is given by the google matrix. As q increases, the pages approach having the same probability. The relative ranking of the websites can change slightly depending on the value of q, however the websites maintain a similar ranking overall. For example the bottom three websites remain within the top four probabilites for the values of q.
| \(q=0\) | \(q=0.15\) | \(q=0.50\) |
| $$ \left[ {\begin{array}{ccccccccccccccc} 0.0155 \\ 0.0104 \\ 0.0080 \\ 0.0108 \\ 0.0311 \\ 0.0311 \\ 0.0432 \\ 0.0217 \\ 0.0854 \\ 0.1182 \\ 0.1040 \\ 0.0760 \\ 0.1553 \\ 0.1482 \\ 0.1411 \end{array} } \right] $$ | $$ \left[ {\begin{array}{ccccccccccccccc} 0.0268 \\ 0.0299 \\ 0.0299 \\ 0.0268 \\ 0.0396 \\ 0.0396 \\ 0.0396 \\ 0.0396 \\ 0.0746 \\ 0.1063 \\ 0.1063 \\ 0.0746 \\ 0.1251 \\ 0.1163 \\ 0.1251 \end{array} } \right] $$ | $$ \left[ {\begin{array}{ccccccccccccccc} 0.0462 \\ 0.0535 \\ 0.0515 \\ 0.0459 \\ 0.0513 \\ 0.0532 \\ 0.0635 \\ 0.0503 \\ 0.0677 \\ 0.0965 \\ 0.0933 \\ 0.0673 \\ 0.0914 \\ 0.0786 \\ 0.0898 \end{array} } \right] $$ |
| $$ 11 \\ 13 \\ 14 \\ 12 \\ 9 \\ 9 \\ 8 \\ 10 \\ 6 \\ 4 \\ 5 \\ 7 \\ 1 \\ 2 \\ 3 \\ $$ | $$ 7 \\ 6 \\ 6 \\ 7 \\ 5 \\ 5 \\ 5 \\ 5 \\ 4 \\ 3 \\ 3 \\ 4 \\ 1 \\ 2 \\ 1 \\ $$ | $$ 13 \\ 9 \\ 10 \\ 14 \\ 11 \\ 9 \\ 8 \\ 12 \\ 6 \\ 1 \\ 2 \\ 7 \\ 3 \\ 5 \\ 4 \\ $$ |
In this section, page 10 was removed from the network and the updated probabilites are shown below. Page 11, now has probability of 0.17 and is the most likely visited page. \[ P=\left( \begin{array}{ccccccccccccccc} 0.0471 \\ 0.0409 \\ 0.0359 \\ 0.0321 \\ 0.0428 \\ 0.0414 \\ 0.0517 \\ 0.0502 \\ 0.0482 \\ 0.1710 \\ 0.1036 \\ 0.0412 \\ 0.1075 \\ 0.1865 \\ \end{array} \right) % \left( \begin{array}{cc} 8 \\ 12 \\ 13 \\ 14 \\ 9 \\ 10 \\ 5 \\ 6 \\ 7 \\ 2 \\ 4 \\ 11 \\ 3 \\ 1 \end{array} \right) =Rank \]
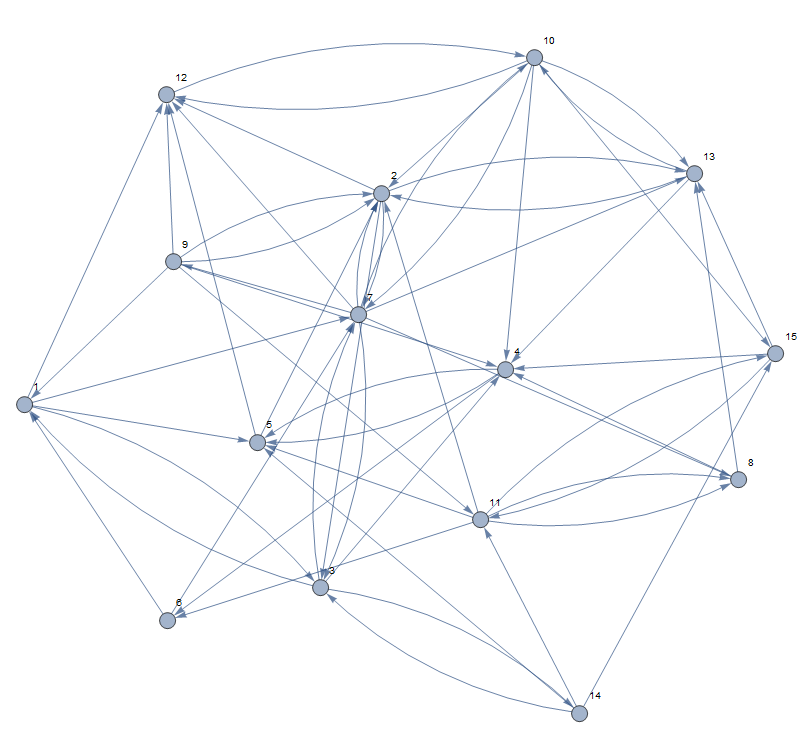
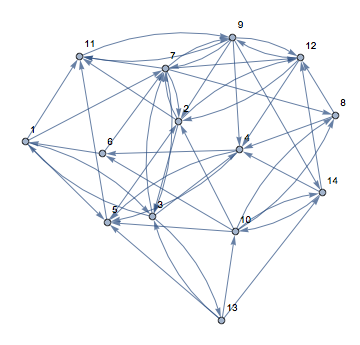
For the final section of the project we created our own network by randomly generating a 15x15 matrix of 1's and 0's in matlab. A graphical representation of the websites can be seen below as well as the Google matrix that corresponds to the network.
The effects of changing \(q=0.00,0.15,0.50\) are shown in the table below.
| \(q=0\) | \(q=0.15\) | \(q=0.50\) |
| $$ \left[ {\begin{array}{ccccccccccccccc} 0.0338 \\ 0.1200 \\ 0.0559 \\ 0.0965 \\ 0.0792 \\ 0.0350 \\ 0.0978 \\ 0.0197 \\ 0.0140 \\ 0.1672 \\ 0.0172 \\ 0.1222 \\ 0.0931 \\ 0.0140 \\ 0.0342 \\ \end{array} } \right] $$ | $$ \left[ {\begin{array}{ccccccccccccccc} 0.0427 \\ 0.1106 \\ 0.0586 \\ 0.0938 \\ 0.0811 \\ 0.0406 \\ 0.0922 \\ 0.0293 \\ 0.0212 \\ 0.1406 \\ 0.0288 \\ 0.1112 \\ 0.0881 \\ 0.0224 \\ 0.0388 \\ \end{array} } \right] $$ | $$ \left[ {\begin{array}{ccccccccccccccc} 0.0574 \\ 0.0906 \\ 0.0627 \\ 0.0859 \\ 0.0785 \\ 0.0518 \\ 0.0807 \\ 0.0475 \\ 0.0391 \\ 0.0965 \\ 0.0502 \\ 0.0885 \\ 0.0788 \\ 0.0412 \\ 0.0507 \\ \end{array} } \right] $$ |
| $$ 11 \\ 3 \\ 8 \\ 5 \\ 7 \\ 9 \\ 4 \\ 12 \\ 14 \\ 1 \\ 13 \\ 2 \\ 6 \\ 14 \\ 10 $$ | $$ 9 \\ 3 \\ 8 \\ 4 \\ 7 \\ 10 \\ 5 \\ 12 \\ 15 \\ 1 \\ 13 \\ 2 \\ 6 \\ 14 \\ 11 $$ | $$ 9 \\ 2 \\ 8 \\ 4 \\ 7 \\ 10 \\ 5 \\ 13 \\ 15 \\ 1 \\ 12 \\ 3 \\ 6 \\ 14 \\ 11 $$ |
Then we changed our network by making both pages 2 and 12 contain a double link to page 7. The results are shown below. Due to pages 2 and 12 both having high probabilities, the affect of having links from 2 and 12 to 7 was drastic. Page number 7 now has the highest probability as it changed from 0.922 to 0.1584. \[ P=\left( \begin{array}{ccccccccccccccc} 0.0438 \\ 0.1101 \\ 0.0622 \\ 0.0875 \\ 0.0777 \\ 0.0387 \\ 0.1584 \\ 0.0371 \\ 0.0292 \\ 0.0832 \\ 0.0278 \\ 0.1062 \\ 0.0842 \\ 0.0232 \\ 0.0307 \\ \end{array} \right) % \left( \begin{array}{cc} 9 \\ 2 \\ 8 \\ 4 \\ 7 \\ 10 \\ 1 \\ 11 \\ 13 \\ 6 \\ 14 \\ 3 \\ 5 \\ 15 \\ 12 \end{array} \right) =Rank \]
In this section, page 9 was removed from the network. The results are shown below. Pages 10, 12, and 2 still remain the most probable webpages, howevere the first and second place rankings have swithced. \[ P=\left( \begin{array}{ccccccccccccccc} 0.0414 \\ 0.1100 \\ 0.0613 \\ 0.0956 \\ 0.0826 \\ 0.0416 \\ 0.0942 \\ 0.0318 \\ 0.1456 \\ 0.0272 \\ 0.1119 \\ 0.0929 \\ 0.0237 \\ 0.0402 \\ \end{array} \right) % \left( \begin{array}{cc} 10 \\ 3 \\ 8 \\ 4 \\ 7 \\ 9 \\ 5 \\ 12 \\ 1 \\ 13 \\ 2 \\ 6 \\ 14 \\ 11 \end{array} \right) =Rank \]