ALGEBRA,
FUNCTIONS, AND DATA ANALYSIS – COURSE 2
PRE-TEST/POST-TEST
Name______________________________
Date_______________________________
![]()
![]() Answer each question below as
completely as possible. Show all applicable work. When noted, justify your
answers. Completion of the test will be limited to 1 ½ hours.
Answer each question below as
completely as possible. Show all applicable work. When noted, justify your
answers. Completion of the test will be limited to 1 ½ hours.
1. 20 students took a test graded out of 60
points. The set of scores is shown
below.
{7,
13, 19, 21, 24, 25, 26, 26, 32, 33, 35, 35, 35, 40, 44, 47, 57, 57, 59, 60}
A. Determine the following:
Mean ____34.75_______ Quartile 1 _____24.5_____ Interquartile
Range __21____
Median ____34___________ Quartile
2_____34_______
Minimum______7_______
Mode _____35__________ Quartile 3_____45.5_______ Maximum____60_______
Range
____53___________
B. Create a box-n-whisker using applicable data
from above. Label.
![]()
![]() Min =7 Max
= 60
Min =7 Max
= 60
![]()
![]()
![]()
![]() 0
4 8 12
16 20 24
28 32 36
40 44 48
52 56 60 64
0
4 8 12
16 20 24
28 32 36
40 44 48
52 56 60 64
Q1 24.5 Q2 34
Q3 45.5
2. What
is the sum of the differences between the given value and the mean? Why?
0
Because the mean is a balance point between all the data.
3. A
set of data is normally distributed with mean 30 and standard deviation 8.
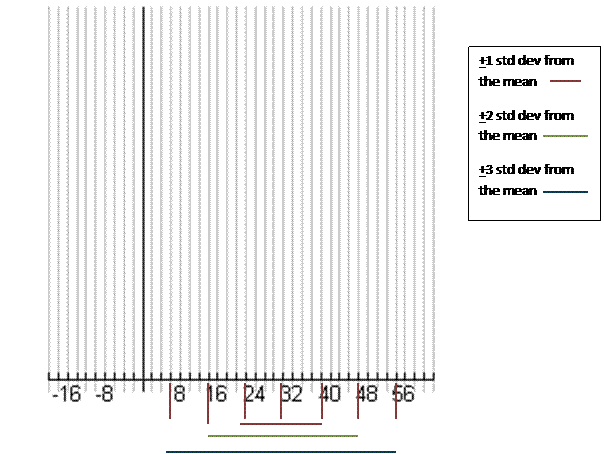 A. Draw the normal curve that will model this
data on the coordinate plane below.
A. Draw the normal curve that will model this
data on the coordinate plane below.
B.
Approximately what percent of the
observations are between the mean and 1 standard deviation to the left of the
mean?
1 standard
deviation from the mean, left and right, is 68%.
Therefore since the normal curve is symmetrical then from the mean to 1 std dev to the left is 34%.
4. Explain
in writing and pictures how changing the mean value changes the normal curve?
Translation of the normal curve. “The Bump” moves so that the high point is at the mean.
5. Explain
in writing and pictures how changing the value of the standard deviation
changes the normal curve?
Scale change.
The normal curve will become flatter and more spread out as the std dev becomes larger. The smaller the std
dev the taller the “bump”.
6. The mean running time for a cross country
race is 150 minutes with a standard deviation of 25,
explain what a z-score of -2 means?
z-score of -2 is 2 standard deviations
below the mean which means 2.5% of the running times are below 100 minutes.
7. An annual corn crop per acre for a Midwestern
state in a particularly good year was normally distributed with a mean of 150
bushels per acre and a standard deviation of 22 bushels per acre.
A. What percent of the farmers harvested between
130 and 180 bushels per acre?
ShadeNorm(130,180,150,22) =
.732008
so 73.2% of the farmers
harvested between 130-180 bushels per acre.
B. How many farmers had a yield of more than 180
bushels per acre?
ShadeNorm(180,x,150,22) = .084991
so 8.5% of the farmers harvested
more than 180 bushels per acre.
8. According to the U.S. Department of Agriculture (www.usda.gov), in 2002, the mean corn crop yield in Ohio was 89 bushels per acre. In 2003, the mean corn crop yield in Ohio was 156 bushels per acre. Assume that the standard deviation in both years was the same at 25 bushels per acre.
A. Farmer Jones had a crop yield of 95 bushels per acre in 2002. Find his z-score for that crop.
z-score = 95-89 =
0.24
25
B. In 2003, Farmer Jones had a crop yield of 150 bushels per acre. Find his z-score for that crop.
z-score = 150-156 = -0.24
25
C. According to the z-scores, in which year did Farmer Jones have a better crop in comparison to his colleagues? Explain your answer.
In 2002,
Farmer Jones had a better crop yield than his fellow farmers. In 2004 his
z-score was actually negative, meaning that while his overall yield was higher,
he actually had a lower crop yield than his fellow farmers.
9. The
school band sells chocolate bars each year as a fundraiser. The table below
shows the number of candy bars that students in the clarinet section sold.
|
63 |
74 |
102 |
63 |
42 |
96 |
|
73 |
68 |
88 |
82 |
61 |
79 |
|
84 |
67 |
56 |
49 |
63 |
94 |
A. Complete the following frequency table.
|
Number
of Candy Bars Sold |
Frequency |
|
40-49 |
2 |
|
50-59 |
1 |
|
60-69 |
6 |
|
70-79 |
3 |
|
80-89 |
3 |
|
90-99 |
2 |
|
100-109 |
1 |
![]()
![]()
![]()
![]()
![]()
![]()
![]()
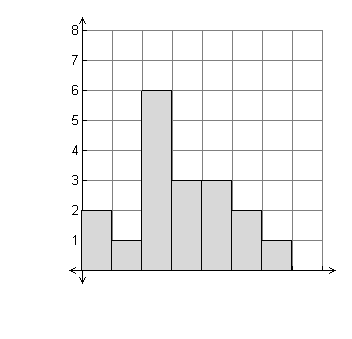 B. Use your frequency table to create a histogram
of the data. Be sure to label axis.
B. Use your frequency table to create a histogram
of the data. Be sure to label axis.
10. The following survey has some form of bias.
Dr.
Aleman wants to survey her patients to determine what kind of foods they like
so that she may better understand their dietary habits. She decides to ask the
next 50 patients that she sees about what kind of foods they like to eat.
Explain
why the type of sampling that was chosen for the survey might lead to biased
results.
If Dr. Aleman
wants to learn about the eating habits of all of her patients, she needs to
choose a sample so that each of her patients has an equally likely chance of
being surveyed. The type of survey that Dr. Aleman has chosen has selection
bias because she is using a convenience sample.
11. A brief account of an experiment is given below:
500
subjects, representing a cross-section of society, are chosen to take part in
an experiment. 250 of them are chosen at
random and instructed to take a vitamin C pill every morning for six
months. The remaining 250 are given a
placebo to take every morning for six months.
The subjects do not know whether they are taking the vitamin C or the
placebo. At the end of six months the
mean number of colds of the subjects that took vitamin C is significantly lower
than those that took the placebo. The
experimenters release a statement that says that vitamin C causes a lower
number of colds.
Do you agree with the experimenters conclusions? Explain.
Since the
experiment includes randomization, control, and has used enough subjects,
causation is an appropriate conclusion.
12. Mrs. Wheeler, the school librarian, wants to determine how many students use the library on a regular basis. What type of sampling method (stratified, simple random, convenience sample, interval sample) would she use if she chose to:
interval sample A. Choose every 3rd student who enters the library on Tuesday.
simple random B. Use a random number generator to randomly select 50 students from the school’s attendance roster.
stratified C. Randomly select 5 students from every student organization.
convenience sampleD. Stand outside the school door and interview the first 50 students who arrive at school on Wednesday.
13. Describe the following pair of events as
dependent or independent. Explain your
answer.
Two six-sided dice—one red and one
blue—are rolled at the same time.
Event 1: The red die shows a 4.
Event 2: The blue die shows a 4.
The events are
independent. The probability of event 2
is 1/6 regardless of whether event 1 has occurred.
14.
Describe the following pair of events as mutually exclusive or not mutually
exclusive. If they are
mutually exclusive, state whether they are complementary. Explain your answer.
One six-sided die is rolled.
Event 1: The die shows an even number.
Event 2: The die shows an odd number.
The events are
mutually exclusive and complementary.
They cannot occur at the same time and either one will occur or the
other will.
15. Each letter for the words STATISTICS and PROBABILITY
is written on a card. All of the cards are placed in a bag.
__3/21 = 1/7 ~ 14%_______ A. What is the probability of randomly drawing the
letter S from
the
bag?
___(1/7)*(1/7) = 1/49____ B. What is the
probability of drawing an S, returning it to the bag,
and
then drawing another S?
___(1/7)*(2/20) =
2/140=1/70 C.
What
is the probability of drawing an S, not returning it to the
bag, and then drawing another S?
___(3/21)+(4/21) =
7/21=1/3_ D.
What is the probability of drawing either an S or a T?
16. A study of 100 adults found 65 that own dogs,
40 that own cats, and 20 that own dogs and cats.
own cats
![]()
 A. Draw
a Venn Diagram that depicts the above relationship.
A. Draw
a Venn Diagram that depicts the above relationship.
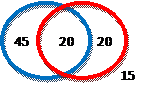
![]()
B. One
of the adults in the study is selected at random. Find the probability that this person owns a
dog.
65/100 = 13/20
C. One
of the cat-owners in the study is selected at random. Find the probability that this person owns a
dog.
20/40
= 1/2
D. Using
the given information, is the event a
person owns a dog independent of the event a person owns a dog?
They are not
independent. If they were independent,
the probability of a person owns a dog would be the same as the person owns a
dog given that the person owns a cat.
17. There are 10 students—6 boys and 4 girls in the
math club.
A. How
many ways can the 10 students line up for a picture?
10! =
3,628,800
B. A
competition team consists of four students without specific designations. Explain whether this is an example of a
combination or permutation and find the number of teams that can be formed.
combinations—the order
the four are selected is not relevant.
10C4
=210
C. One
boy and one girl will be crowned math club king and queen. How many different couples are possible?
6 ( 4) = 24