Getting Started on the TI-83
Graphing, Tables, and More!
 |
1. Press MODE. You always check to see how your calculator is set up. Use the arrow down key and the arrow right key to highlight a setting. Press ENTER to select a setting. Set your screen to look like the screen on the left. Press 2nd QUIT to get back to the home screen. |

 |
2. To make sure all statistical plots and graphs are turned off before you start your work, press Y=. If any = signs or Plot# are highlighted, arrow to the highlighted area and press ENTER to turn off the graph or plot. See also, 2nd, CATALOG, PlotsOff and FnOff. |
 |
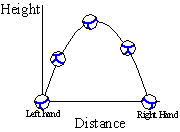
Example: Take a piece of paper and crush it into a ball. Throw it up and over from your left hand to your right hand. Watch the path of the paper ball in the air. What path does the paper follow? There is a function that takes on this shape! Given a bit more information about your toss, velocity of your throw, angle of toss, your height..., we could find that equation. We will use the function f(x) = x(24-x) for now. f(x) is the height of the ball and x will measure the distance between our hands in cm. |
 |
3. To enter a function, press Y=. Type in the function you see at the left. You can use the X,T,Theta,n key to pull an X up to the screen. Notice that the = sign is highlighted. That indicates that Y1 will be graphed. The left hand column on your Y= screen gives you the option of graphing dotted lines, thick lines, etc. Arrow to the left hand column and press ENTER to toggle through the choices of graph. |
 |
4. Set up the viewing area. This one is set up for you. Press WINDOW. Use the arrow keys to change your window values. Xscl and Yscl are the distance between the tick marks on the axes. (Later, investigate ZOOM!) |
 |
5. Before we graph the function, press 2nd FORMAT to see how the graphing window is set up. Set your window as shown on the screen. |
 |
6. Now press GRAPH. If you need to change the window, press WINDOW and make the changes. This window shows more than the physical. Always ask, "Is this what I expected to see?" Does this look like your paper ball toss? |
 |
7. Press TRACE. Notice the flashing cursor and the values at the bottom of the screen. Use right and left arrow keys to move the cursor on the graph. Notice that the graphing window is set up to show the function. You can press TRACE and arrow OR press TRACE and then ENTER a number to go to any value! You also see the function on the screen!) |
  |
8. Now we will set up to look at the numbers. To set up a table of values, press 2nd TblSet (above WINDOW). TblMin is the start of the table. Tbl is the increment. (read Delta Table) Use the arrow keys to set the values given at the left. Note: If you change to Ask, then you will be able to enter various values in the table as you like. Press 2nd TABLE (above GRAPH). Use the arrow keys to see more values. How far apart are the left and right hands for this toss? How can you use this table feature to find the maximum height of the ball? Try it. Go back and change the TblSet screen to search for a maximum. |
 |
9. Find a particular value of a function. Find f(6). Press 2nd CALC (above TRACE). Press 1 for 1:value. You can do this from TRACE. |
  |
10. Find the value of the function at X = 6. Press 6 and ENTER. The value appears at the bottom of the screen. Is this answer reasonable? |
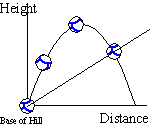
| Example: Now, you toss your paper ball again. This time you are at the base of a hill. Toss your ball up the hill. Where does it land? How high did it go? What shapes are we working with? |  |
 |
11. Enter another function, f(x) = 6x. This will be our hill. Press Y =. Type in Y2. Arrow to the left hand column and press ENTER to change the graph to thick. |
 |
12. Press GRAPH. Is this what you expected to see? Where is the point where your paper ball hit the hill? Write a guess here. |
 |
13. Where does the ball hit the hill? Find where the functions intersect. Press 2nd CALC. Press 5 for 5:intersect. |
 |
14. Use the arrow keys to place the cursor on the one curve. Press ENTER to set the first curve. |
 |
15. The cursor jumped to the second function. Press ENTER. (If there were more functions graphed, you would have to use the arrow key to put the cursor on the function you want.) |
  |
16. Arrow to a guess near the intersection you want to find and press ENTER. Notice that there are two points of intersection. |
 |
17. Press ENTER and the intersection will be calculated. The screen shows the intersection at (18, 108). Is this an approximation or the exact intersection? |
 |
18. How high did your toss go above the level ground? Write your guess here. Find the maximum value of Y1 on the window given. Press 2nd CALC. Press 4 for 4:maximum and press ENTER. |
 |
19. You will be asked to give some information about the location of the maximum. First arrow to a lower bound. This should be an x value which has an output smaller than the maximum. Press ENTER. |
  |
20. For the right bound, arrow past the maximum and press ENTER to give an x value which has an output value bigger than the maximum. |
  |
21. Move the cursor in for the guess and press ENTER. An approximation to the maximum appears at the bottom of the screen. This is the height above the level ground. Was your guess close? |
Try this: Find the maximum height that the ball reached above the hill. How does this question differ from what was found above?
 |
Copyright  1998 by
Margo Lynn Mankus 1998 by
Margo Lynn Mankus
May be copied for classroom use. |