Introduction
By identifying those tweets who mention their author got flu, the goal is to utilize Twitter data as social sensors to sense the spatiotemporal patterns of influenza outbreaks for different locations and dates.
Processsed Data
Download link: [Processed Data]
Data format: *.mat (use Matlab to open)
Data description:
Variable Name |
Type | Size | Description |
| flu_keywords | array of string | 1*525 | keyword list to represent a tweet message into a document vector |
| flu_locs | array of string | 1*48 | location names of 48 states in USA |
| flu_X_te | array of matrices | 1*48 | test set input data: tweet data for 48 locations from 2014-01-01 to 2015-04-01
|
| flu_X_tr | array of matrices | 1*48 | training set input data: tweet data for 48 locations from 2011-01-01 to 2013-12-31
|
| flu_Y_te | array of matrices | 1*48 | test set output data: outbreak occurrence data for 48 locations from 2014-01-01 to 2015-04-01
|
| flu_Y_tr | array of matrices | 1*48 | training set output data: outbreak occurrence for 48 locations from 2011-01-01 to 2013-12-31
|
Data Source
Input: All the tweet messages that mention their author got flu during early 2011 to late 2014. See the procedure on how these tweets are retrieved in the paper [TKDE].
Download link: [Input Raw Data]
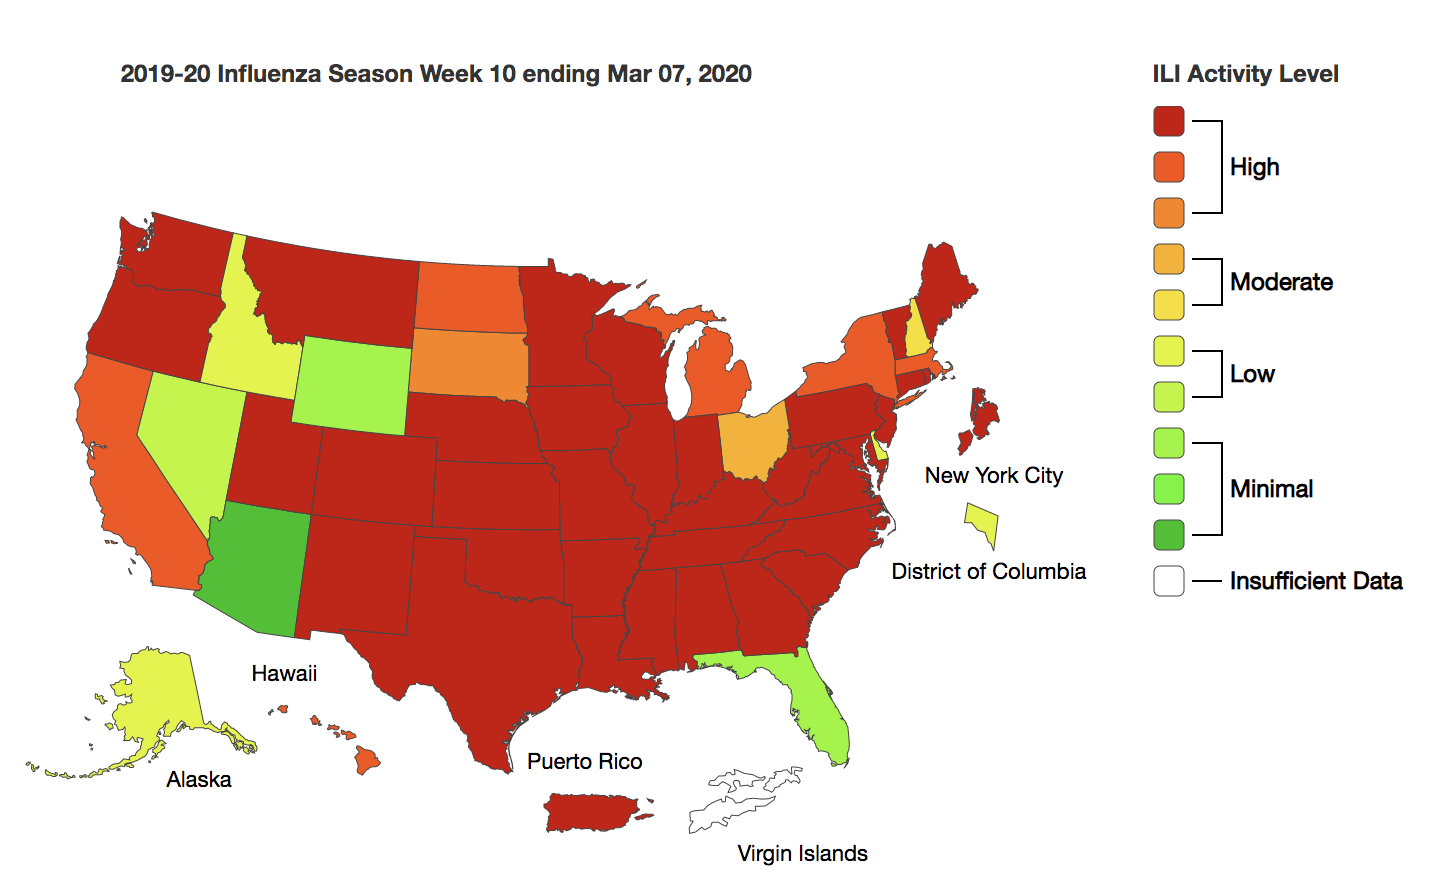
Label: Influenza outbreak during early 2011 to late 2014 report by the government, namely Flu Activity Map from the Center of Disease Control and Internvention. There are four levels of flu acivities from minimal to high as shown in the following figure. An influenza oubreak occurrence is indicated if the acivity level is high.
Citation
To use these datasets, please cite the papers:
Liang Zhao, Qian Sun, Jieping Ye, Feng Chen, Chang-Tien Lu, and Naren Ramakrishnan. “Feature Constrained Multi-Task Learnings for Event Forecasting in Social Media." IEEE Transactions on Knowledge and Data Engineering (TKDE), (impact factor: 3.438), vol. 29, no. 5, pp. 1059-1072, May 1 2017.
Liang Zhao, Jiangzhuo Chen, Feng Chen, Wei Wang, Chang-Tien Lu, and Naren Ramakrishnan. "SimNest: Social Media Nested Epidemic Simulation via Online Semi-supervised Deep Learning." in Proceedings of the IEEE International Conference on Data Mining (ICDM 2015), regular paper (acceptance rate: 8.4%), Atlantic City, NJ, pp. 639-648, Nov 2015.
Acknowledgement

NSF 1755850 (sole-PI): "CRII: III: Interpretable Models for Spatio-Temporal Event Forecasting using Social Sensors", $174,990. 2018-2021, National Science Foundation.
