Linda A. Hinnov
Professor of Geology
Department of Atmospheric, Oceanic and Earth Sciences
George Mason University
1. Early Triassic Milankovitch cycles in South China
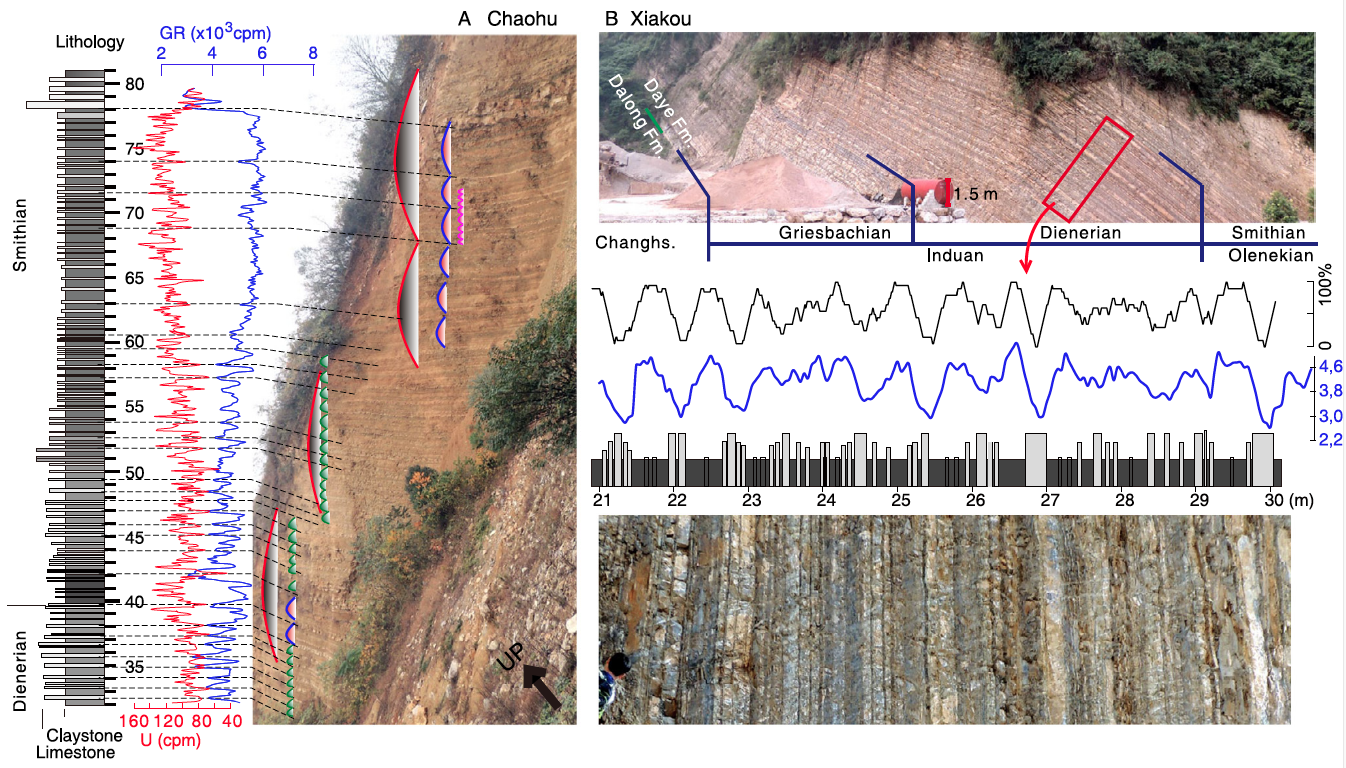
A. Chaohu section of upper Dienerian and Smithian (photograph rotated to correspond to the stratigraphic column). GR (blue curve) and U (red curve) with interpreted astronomical cycles of precession (marked by the green line) grouped into short-eccentricity bundles (pink-filled arcs) that are modulated in long-eccentricity bundle-sets (grey-filled arcs). B. Daxiakou section. GR (blue curve) from 21 to 30.6 m compared with a 20-cm sliding window of percent non-carbonate (black curve). (Li et al., 2016a)
2. The Early Triassic hothouse, sea level and the astronomical timescale
Early Triassic obliquity cycles and selected geological events (below). (A) Modeled O/T (obliquity variance/total variance) of La2004 and La2010d astronomical models. Filtered 1.2 m.y. obliquity amplitude modulation cycles (B) of observed O/T at Chaohu (blue line) and Daxiakou (red line) (C). (D) Spores and pollen in Pakistan (Hermann et al., 2012). (E) Ammonoid genera from low (black dots), middle (blue dots), and high (orange dots) latitudes (Brayard et al., 2006). (F) Global sea level (Snedden and Liu, 2010). (G) Cooling episodes based on d18O of conodont apatite from South China and Pakistan. (H) d13C_carb from South China (Payne et al.,2004). (I) Redox state in Canadian Arctic (Grasby et al., 2013). (J) Eruption model of Siberian Traps based on Burgess and Bowring (2015).( K) Ages for events and substage boundaries from Burgess et al. (2014) (**), Burgess and Bowring (2015) (#) and Li et al. (2016a) (*). Dashed vertical lines indicate substage boundaries used for calibrating events. Changhsing.=Changhsingian; Di.=Dienerian. (Li et al., 2016b)
