Paleoclimates eGuide
VIRTUAL RESEARCH INSTRUCTIONS
WAVELET ANALYSIS OF EARTH'S PALEOCLIMATES
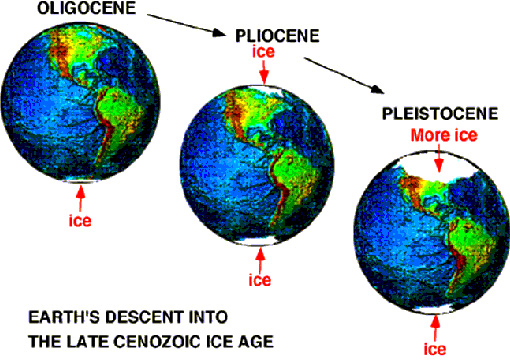
This research project explores the climate dynamics of the Earth's descent into the Late Cenozoic Ice Age, through examination of two 4.8 million year-long global ice volume proxy time series obtained from biogenic sediment deposits in the Atlantic and Pacific Oceans. Global ice volumes waxed and waned in concert with the Earth's orbital rhythms, with a tremendous surge in the total ice budget occurring over the last 1 million years:
DIRECTIONS:
(1) Download the Atlantic Ocean time series ODP659.txt
(2) Download the Pacific Ocean time series ODP849.txt
(3) Read these text files into Excel; the first column is time in 1000's of years (kyrs), and the second column is oxygen isotope ratio (per mill). The sample rate for both series has been linearly interpolated to a uniform Dt = 5 kyrs. Wavelet analysis provides a means to assess the presence and relative strength of orbital rhythms in the ice budget, and to identify pivotal transitions in the global climate.
(4) Go to A Practical Guide to Wavelet Analysis (University of Colorado) (http://paos.colorado.edu/research/wavelets/ ) and select "3. Interactive Wavelet Plot." Familiarize yourself with the tool by running the provided demonstration datasets (El Nińo, Monsoon, CO2 and sunspots) and consulting the referenced publication.
(5) Copy/paste Column 2 of the ODP data into the box provided for "your data," enter "5" into the lowermost box at the left labeled "X interval" and submit.
(6) The "PERIOD" axis on the wavelet scalogram must be divided by 5 (the sample rate) to obtain wavelet periodicity in kyrs. Adjust START SCALE to "1" and SCALE WIDTH to "0.2" and submit again; this helps to focus the wavelet frequency bands.
(7) Copy the results (a single image) onto your desktop for further study.