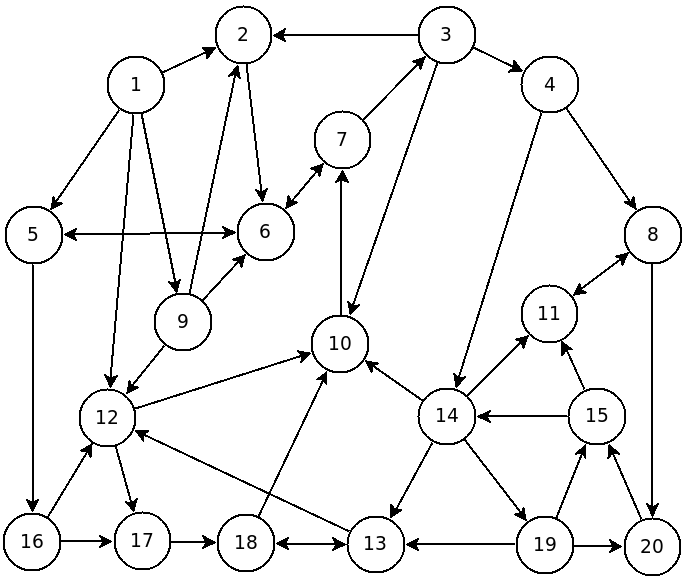
\[A = \begin{bmatrix} 0 & 1 & 0 & 0 & 1 & 0 & 0 & 0 & 1 & 0 & 0 & 1 & 0 & 0 & 0 & 0 & 0 & 0 & 0 & 0 \\ 0 & 0 & 0 & 0 & 0 & 1 & 0 & 0 & 0 & 0 & 0 & 0 & 0 & 0 & 0 & 0 & 0 & 0 & 0 & 0 \\ 0 & 1 & 0 & 1 & 0 & 0 & 0 & 0 & 0 & 1 & 0 & 0 & 0 & 0 & 0 & 0 & 0 & 0 & 0 & 0 \\ 0 & 0 & 0 & 0 & 0 & 0 & 0 & 1 & 0 & 0 & 0 & 0 & 0 & 1 & 0 & 0 & 0 & 0 & 0 & 0 \\ 0 & 0 & 0 & 0 & 0 & 1 & 0 & 0 & 0 & 0 & 0 & 0 & 0 & 0 & 0 & 1 & 0 & 0 & 0 & 0 \\ 0 & 0 & 0 & 0 & 1 & 0 & 1 & 0 & 0 & 0 & 0 & 0 & 0 & 0 & 0 & 0 & 0 & 0 & 0 & 0 \\ 0 & 0 & 1 & 0 & 0 & 1 & 0 & 0 & 0 & 0 & 0 & 0 & 0 & 0 & 0 & 0 & 0 & 0 & 0 & 0 \\ 0 & 0 & 0 & 0 & 0 & 0 & 0 & 0 & 0 & 0 & 1 & 0 & 0 & 0 & 0 & 0 & 0 & 0 & 0 & 1 \\ 0 & 1 & 0 & 0 & 0 & 1 & 0 & 0 & 0 & 0 & 0 & 1 & 0 & 0 & 0 & 0 & 0 & 0 & 0 & 0 \\ 0 & 0 & 0 & 0 & 0 & 0 & 1 & 0 & 0 & 0 & 0 & 0 & 0 & 0 & 0 & 0 & 0 & 0 & 0 & 0 \\ 0 & 0 & 0 & 0 & 0 & 0 & 0 & 1 & 0 & 0 & 0 & 0 & 0 & 0 & 0 & 0 & 0 & 0 & 0 & 0 \\ 0 & 0 & 0 & 0 & 0 & 0 & 0 & 0 & 0 & 1 & 0 & 0 & 0 & 0 & 0 & 0 & 1 & 0 & 0 & 0 \\ 0 & 0 & 0 & 0 & 0 & 0 & 0 & 0 & 0 & 0 & 0 & 1 & 0 & 0 & 0 & 0 & 0 & 1 & 0 & 0 \\ 0 & 0 & 0 & 0 & 0 & 0 & 0 & 0 & 0 & 1 & 1 & 0 & 1 & 0 & 0 & 0 & 0 & 0 & 1 & 0 \\ 0 & 0 & 0 & 0 & 0 & 0 & 0 & 0 & 0 & 0 & 1 & 0 & 0 & 1 & 0 & 0 & 0 & 0 & 0 & 0 \\ 0 & 0 & 0 & 0 & 0 & 0 & 0 & 0 & 0 & 0 & 0 & 1 & 0 & 0 & 0 & 0 & 1 & 0 & 0 & 0 \\ 0 & 0 & 0 & 0 & 0 & 0 & 0 & 0 & 0 & 0 & 0 & 0 & 0 & 0 & 0 & 0 & 0 & 1 & 0 & 0 \\ 0 & 0 & 0 & 0 & 0 & 0 & 0 & 0 & 0 & 1 & 0 & 0 & 1 & 0 & 0 & 0 & 0 & 0 & 0 & 0 \\ 0 & 0 & 0 & 0 & 0 & 0 & 0 & 0 & 0 & 0 & 0 & 0 & 1 & 0 & 1 & 0 & 0 & 0 & 0 & 1 \\ 0 & 0 & 0 & 0 & 0 & 0 & 0 & 0 & 0 & 0 & 0 & 0 & 0 & 0 & 1 & 0 & 0 & 0 & 0 & 0 \end{bmatrix}\]
First, the network was evaluated using different values for q. \[\begin{align} p &= \begin{bmatrix} 0.0075 \\ 0.0280 \\ 0.0578 \\ 0.0239 \\ 0.0548 \\ 0.1075 \\ 0.1184 \\ 0.0768 \\ 0.0091 \\ 0.0767 \\ 0.0696 \\ 0.0443 \\ 0.0459 \\ 0.0388 \\ 0.0499 \\ 0.0308 \\ 0.0394 \\ 0.0605 \\ 0.0158 \\ 0.0446 \end{bmatrix} & p_{q=0.0} &= \begin{bmatrix} 0 \\ 0.0220 \\ 0.0659 \\ 0.0220 \\ 0.0585 \\ 0.1171 \\ 0.1317 \\ 0.0941 \\ 0 \\ 0.0732 \\ 0.0831 \\ 0.0335 \\ 0.0376 \\ 0.0376 \\ 0.0533 \\ 0.0293 \\ 0.0314 \\ 0.0502 \\ 0.0094 \\ 0.0502 \end{bmatrix} & p_{q=0.5} &= \begin{bmatrix} 0.0250 \\ 0.0403 \\ 0.0448 \\ 0.0325 \\ 0.0486 \\ 0.0818 \\ 0.0792 \\ 0.0630 \\ 0.0281 \\ 0.0675 \\ 0.0598 \\ 0.0549 \\ 0.0514 \\ 0.0464 \\ 0.0531 \\ 0.0371 \\ 0.0480 \\ 0.0619 \\ 0.0308 \\ 0.0459 \end{bmatrix} \end{align}\] In addition to the trend uncovered with the example network, the page rankings for nodes 1 and 9 have fallen to zero when \(q\) = 0. From the diagram, it can be seen that no links lead to node 1 and only node 1 links to node 9. Without the "global" jump probability, there is no way to reach nodes 1 and, consequently, node 9.
Next, links were selected to manipulate. Node 12 is a high traffic node and links to nodes 10 (another high traffic node) and 17. The link from node 12 to 17 was changed to 4 and the resultant page rankings printed. As a second test case, the link from node 7 to 6 was changed to 4. Nodes 7 and 6 are the highest ranked nodes, and we wanted to see if this would push 6 above 7. \[\begin{align} p &= \begin{bmatrix} 0.0075 \\ 0.0280 \\ 0.0578 \\ 0.0239 \\ 0.0548 \\ \textbf{0.1075} \\ 0.1184 \\ 0.0768 \\ 0.0091 \\ 0.0767 \\ 0.0696 \\ 0.0443 \\ 0.0459 \\ 0.0388 \\ 0.0499 \\ 0.0308 \\ \textbf{0.0394} \\ 0.0605 \\ 0.0158 \\ 0.0446 \end{bmatrix} & p_{12,17=4} &= \begin{bmatrix} 0.0075 \\ 0.0271 \\ 0.0544 \\ 0.0229 \\ 0.0526 \\ 0.1024 \\ 0.1105 \\ 0.0757 \\ 0.0091 \\ 0.0699 \\ 0.0688 \\ 0.0461 \\ 0.0511 \\ 0.0383 \\ 0.0494 \\ 0.0299 \\ \textbf{0.0515} \\ 0.0730 \\ 0.0156 \\ 0.0441 \end{bmatrix} & p_{7,6=4} &= \begin{bmatrix} 0.0075 \\ 0.0200 \\ 0.0294 \\ 0.0158 \\ 0.0705 \\ \textbf{0.1445} \\ 0.1286 \\ 0.0679 \\ 0.0091 \\ 0.0703 \\ 0.0631 \\ 0.0472 \\ 0.0461 \\ 0.0338 \\ 0.0461 \\ 0.0375 \\ 0.0435 \\ 0.0640 \\ 0.0147 \\ 0.0405 \end{bmatrix} \end{align}\]
Finally, a node was removed and the results recorded. Similar to in the example network, node 10 is a high traffic node with only one outgoing link, causing node 7 to be the highest ranked page in the network. We chose to remove it. \[\begin{align} p &= \begin{bmatrix} 0.0075 \\ 0.0280 \\ 0.0578 \\ 0.0239 \\ 0.0548 \\ 0.1075 \\ 0.1184 \\ 0.0768 \\ 0.0091 \\ 0.0767 \\ 0.0696 \\ 0.0443 \\ 0.0459 \\ 0.0388 \\ 0.0499 \\ 0.0308 \\ 0.0394 \\ 0.0605 \\ 0.0158 \\ 0.0446 \end{bmatrix} & p_{new} = \begin{bmatrix} 0.0079 \\ 0.0214 \\ 0.0215 \\ 0.0170 \\ 0.0337 \\ 0.0567 \\ 0.0320 \\ 0.0780 \\ 0.0096 \\ \\ 0.0740 \\ 0.0851 \\ 0.1491 \\ 0.0374 \\ 0.0525 \\ 0.0222 \\ 0.0897 \\ 0.1475 \\ 0.0185 \\ 0.0463 \end{bmatrix} \end{align}\] Again, as expected, the page rank for the downstream node (7 in this case) dropped sharply. Removing node 10 caused node 12 to have only one outgoing link, which feeds into node 18. Node 18 links to two other nodes, but the link to node 13, the new highest ranked node, is bidirectional, causing each node to accumlate page rank in a loop. Below is a summary of the page rank changes. \[\begin{align}Increase &: {p_1,p_9,p_{11},p_{12},p_{13},p_{15},p_{17},p_{18}, p_{19}, p_{20}} \\ Decrease &: {p_2, p_3, p_4, p_5, p_6, p_7, p_8, p_{14}, p_{16}} \end{align}\]