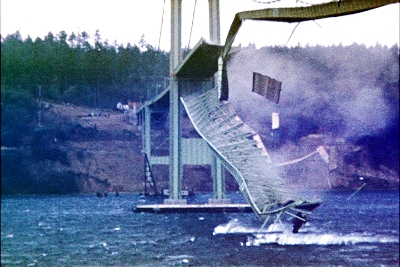

In this project, a model, given by McKenna and Tuama was used in an attempt to re-enact the Tacoma Narrows Bridge Incident. The famous incident occurred on November 7th, 1940 in Tacoma, Washington and on that day, the bridge famously collapsed. In the context of the project, a two-dimensional representation of the bridge was modeled. Specifically, the roadway hanging between the two support cables as seen below:

Given below are the second-order differential equations for motion. In these equations, K denotes Hooke's constant:
However, in their model, McKenna and Tuama propose that the cables pull back with more force when when stretched then they do when they are compressed. As a result, in their model, they replace the Hooke's Law restoring force:
with a nonlinear force:
Thus, the equations describing the motions of the bridge are now:
Where 2l is the width of the roadway.
Now, one more element must be added, the wind! In order to model the wind, the right hand side of the y equation is multiplied by 0.2W sin wt. Some other constants are in order as well:
These constants are only guesses, but it will be demonstrated that they suffice in producing a satisfactory model of the bridge's behavior.
1. In the first part of the project, the function, tacmoa.m (provided by Dr. Sauer), was run with the following initial conditions:
with the wind set to 80 km/hr.
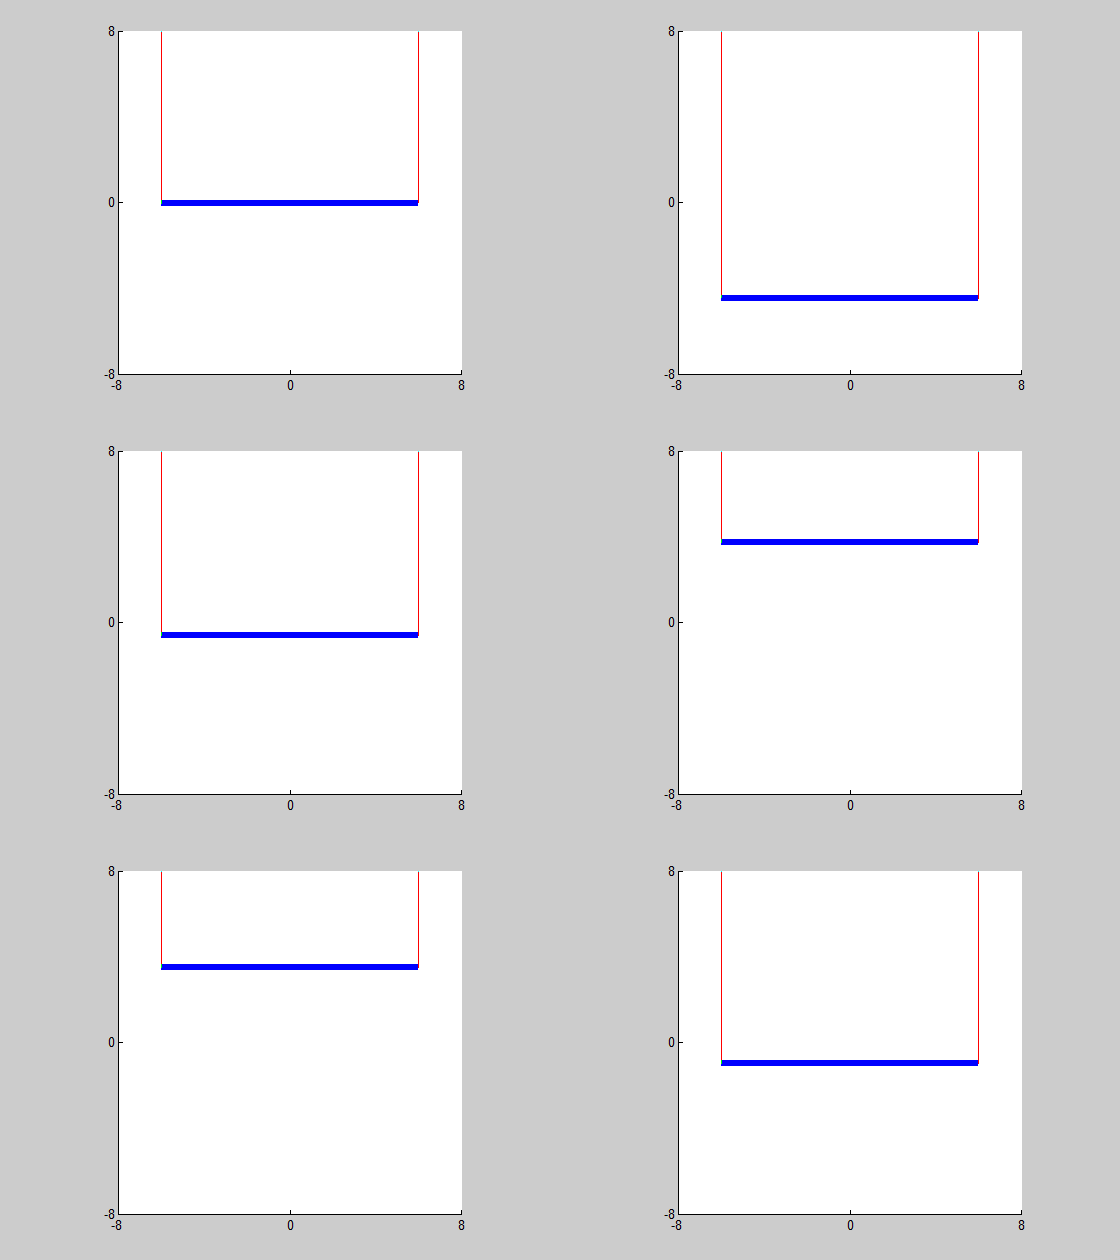
Note that this was performed with the Trapezoid Method
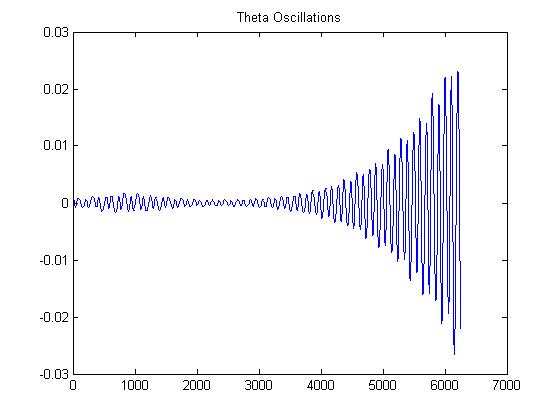
Based on our results, with a wind speed of 80, the bridge is NOT stable. This is because small disturbances in theta grow considerably beyond their original size. The Tacoma Narrows Bridge fell when the wind was 68 km/h, so it would make sense that a higher wind speed would have the same result.
2. Next, in order to improve accuracy, the Runge-Kutta Method was implemented. The Runge-Kutta Method is a Fourth Order ODE Approximation Method. It represents an improvement over the Euler Method, Trapezoid Method, and the Midpoint Method. In fact, it is similar to using the Midpoint Method twice over an interval. The Runge-Kutta Method is given by:
where
Now, when one iterates over the interval they have a much
improved approximation over Euler's Method. While the Runge-Kutta Method does require four function calls per step, the error trunction, which is on the order of
more than makes up for it.
In addition the implementing the Runge-Kutta Method, the values of the height and theta were plotted:
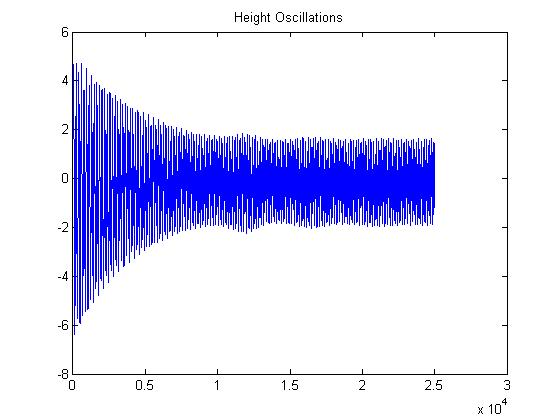
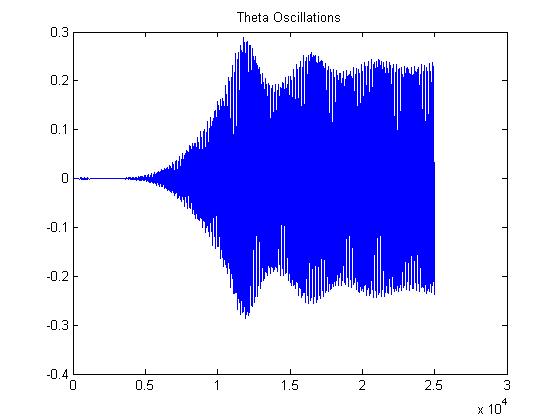
The height plot resembles some kind of decaying exponential. The plot of the height on the other hand, mushrooms, then oscillates around a threshold.
3. In part three, the following question was posed:
"The system is torsionally stable for W = 50 km/hr. Find the magnification factor for a small initial angle. That is, set
and find the ratio of the maximum angle
.
Is the magnification factor approximately consistent for initial angles
"
The results are recorded in the table below:
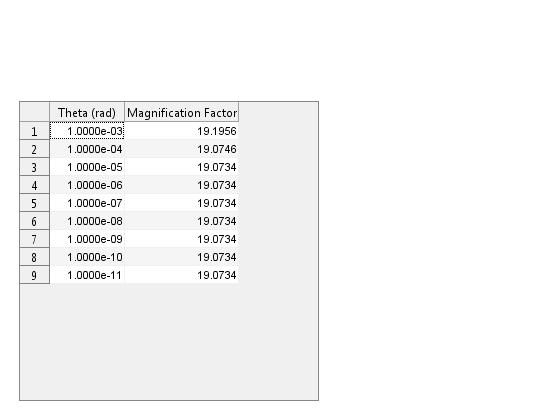
Based on the calculations in the table above, we conclude that the magnification factor is extremely consistant for inital angles of theta.
4. The next matter to be determined was to determine the minimum wind speed, W, for which a small disturbance
induced a magnification factor of 100 or more. Once that was determined, could one define a consistent magnification factor for this W?
By successive incremental iterations, a wind speed of 58.99 km/hr yields a magnification factor of 100. To aid in the answer of the latter problem, a plot of theta is given below:
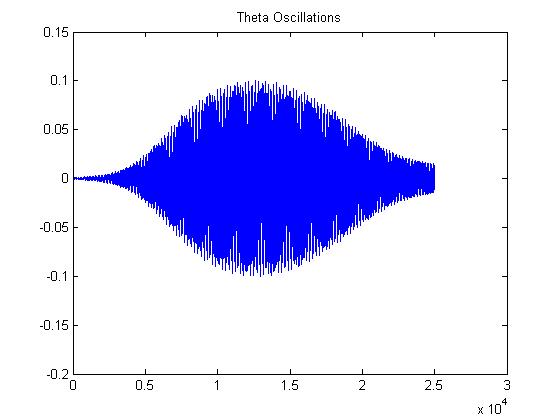
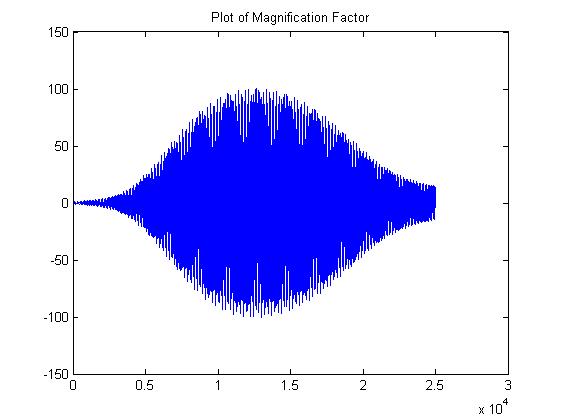
As one can see in the plot above, it is not so easy to define a consistent magnification factor for the wind speed. One does not see a linear plot or something exponential. In general, the oscillations mushroom, peak at a maximum, then decay back down. Keeping in mind that theta is defined as the angle the roadway makes with the horizontal, ANY oscillation is quite bad! A plot of the Magnification Factor is given below.
5. The rest of the problems, as well as the conclusion of the project are located on the website of my partner, Shareef Sayed:
Bridge Collapse image courtesy of http://upload.wikimedia.org/wikipedia/en/5/5c/TacomaNarrowsBridgeCollapse_in_color.jpg
Sauer, T. Numerical Analysis 2nd Ed. Pearson