Modeling of Protein-Small Molecule
Complexes:
Human serum albumin (2vdb), S-naproxen
(NPS)
Part I
Intro
In this assignment the structure of a heterocompound complexed within a protein is investigated in multiple modes. The protein chosen is human serum albumin, the structure for which was first found using protein databases [1][8]. A 3D model of the protein was downloaded from a database and opened using the program DS Visualizer. The individual heterocompound chosen from this protein is (2s)-2-(6-methoxynaphthalen-2-yl) propanoic acid or S-naproxen (het-code: NPS). This heterocompound was extracted then opened in a new file so that the structure could be analyzed further [2].
Background: Function of S-naproxen in
Albumin
Naproxen itself is used as a non-steroid anti-inflammatory drug (or NSAID), prescribed to arthritis patients in high doses. It has an over the counter (OTC) form as well which can be used as a fever reducer and pain reliever [5]. Human serum albumin (HSA) is a plasma protein which is responsible for the transport of vitamins, minerals, hormones and fatty acids through the blood. Naproxen is complexed within HSA to assist in determining the location of fatty acid binding sites HSA possesses [7]. Properties of naproxen that allow it to bind to this protein well include its electron affinity and the delocalized negative charge of its carboxylic acid group which make it acidic in nature [6]. This will be elaborated on in Part II when the protein-ligand interaction of this heterocompound is explored in more detail.
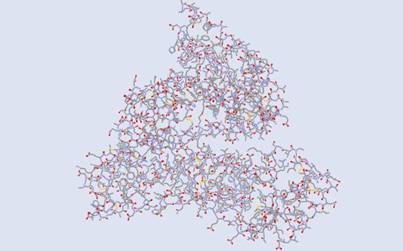
Fig
1.The structure above is the original protein, human serum albumin as seen
in
DS Visualizer.
Extraction
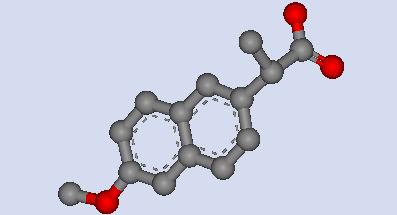
Fig
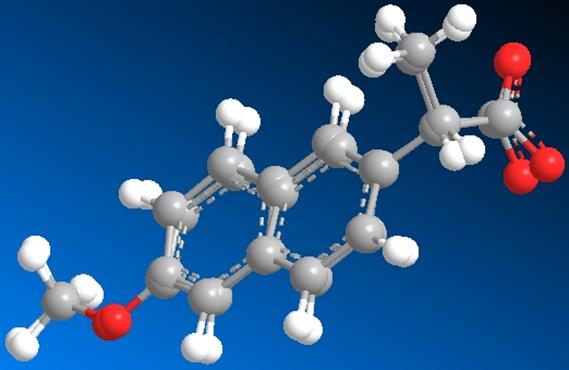
2. This is a depiction of the extracted heterocompound, S-naproxen (C14H14O3),
as
seen in DS Visualizer.
The Lewis structure of S-naproxen was then analyzed and created using Chemsketch. S-naproxen consists of two benzene rings, carboxylic acid group and a methoxide group. The formal charge of the carboxylic acid group is -1 due to deprotonation of the hydrogen on the singly bonded oxygen atom. The chemical formula of the compound was therefore C14H13O3 instead of C14H14O3 when it is complexed within human serum albumin. Chemsketch was used to create a Lewis structure S-naproxen so that the deprotonated acidic property of the carboxylic acid group can be shown.

Fig
3.This is the Lewis structure for S-naproxen. There are two pairs of
non-bonded
electrons on each oxygen atom of the carboxylic acid group
as well as the oxygen of the methoxide group.
The original protein structure for human serum albumin was reopened in DS Visualizer and converted to a solid ribbon form, save for the heterocompound S-naproxen. S-naproxen was then converted to CPK form. This rendition of the image gives a clearer view to the relative location of the heterocompound within the protein structure. This is viewable on the next page. S-naproxen is displayed in a planar view from the side in the following image rather than from the top as it is in the ball and stick form on the previous page.
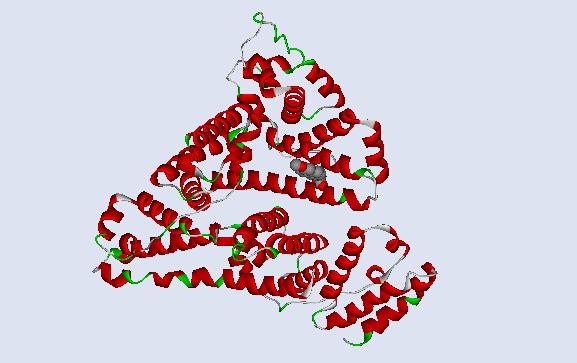
Fig
4. Human serum albumin protein complex is in the ribbon form and S-naproxen is
represented
in the CPK form.
Once the structure for S-naproxen is confirmed to match with the literature stereochemistry, the steric energy of the compound is determined using Chem 3D. In this step, the most preferable orientation of S-naproxen must be determined through minimization in Chem 3D. This will then be compared to the steric energy of the compound as it appears in the so that the heterocompound can be analyzed further. First, a single-point energy calculation of S-naproxen as it appears in human serum albumin was performed. This structure and the data generated were saved. Next, the structure was minimized using an MM2 calculation. The output was then saved in a table for comparison:
Energy Calculations
Table 1: S-naproxen steric energy
values


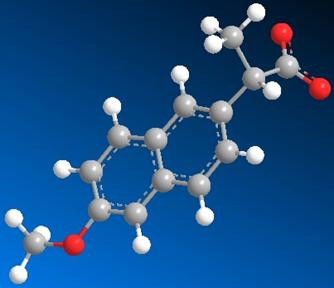
Fig 5. The image on the left is the structure of S-naproxen
as it exists in human serum albumin. The image on the left is the minimized
structure. This represents the geometric conformation at which the energy of
the compound is the lowest and therefore most preferable. The difference in
energy between the two conformations is evident in the calculations shown in
the table.
The Images above serve as comparisons in the structure of S-naproxen after a single point energy calculation and after energy minimization (MM2). Single point energy is a calculation of the potential energy surface of a compound at a given conformation. There are specific conformations that are more energetically preferable depending upon the placement of electron withdrawing groups and lone pairs. The single point energy calculation only displays the energy of the compound as it exists in the protein. To determine the angles at which the compound will have the least potential energy surface and what those exact energy values are a geometry optimization or minimization energy calculation was conducted using Chem 3D.
A dramatic change in energy can be observed from the data on Table 1. Each individual component contributed to this major difference. The energy values, or components, generated include: stretch, bend, stretch-bend, torsion, non-1,4 van der Waals, 1,4 van der Waals, dipole-dipole and the total energy [4].
Stretch represents the energy generated when the optimal length of bonds within the compound are distorted. The higher the deviation, the higher the energy becomes. A dramatic difference can be noted between the stretch of the minimized conformation (only .753kcal/mol) and the structure as it exists in the protein (~11.38kcal/mol). The stretch energy shows the greatest energy change meaning that the structure of S-naproxen becomes highly distorted due to attractions from surrounding protein structures.
Bend is a measurement of the energy released when deforming angles of the compound from optimal values. The bend of the compound before and after minimization shifts substantially. Bond angles of S-naproxen are altered due to changes in structure when it bonds with structures within the protein. This measurement would be expected to decrease as the stretch component did since stretching of bond lengths can cause stretching of bond angles as well.
Stretch-bend is the energy required to stretch two bonds involved in a bond angle when the bond angle is compressed. According to the results, more energy is required to stretch the bonds of the minimized structure than the S-naproxen within albumin. This implies that the angles of the minimized structure are more compressed than that of the non-minimized structure which contributes to the higher energy value.
Torsion represents the energy formed when torsional angles in the molecule are deformed from the ideal formation. There is only a slight difference in the torsional angles of the compound in both minimized and non-minimized forms which means that torsional strain does not contribute significantly to the change in total energy.
Non-1,4 van der Waals is a representation of the energy of the interaction between pairs of atoms that are separated by multiple atoms (usually about 3). For example the interaction between an oxygen atom of the carboxylic acid group and the hydrogen of the methyl group of the second carbon. There is only a slight decrease in non-1,4 van der Waals interaction energy which indicates that there was a small shift in the positioning of the structures involved when they were minimized. The further apart the atoms become, the weaker their van der Waals interaction.
1,4 van der Waals is the energy of interaction between atoms separated by two other atoms. There is a slight decrease in this energy after minimization, indicating that the two atoms involved have been moved apart further. This could be caused by change in the position of the carboxylic acid substituent.
The Dipole/Dipole energy is a calculation of the energy of the interaction of bond dipoles. There is a very slight change in this energy, however, so it does not significantly contribute to the decrease in total energy during minimization. The formal charge of S-naproxen is 0 for every atom except the deprotonated singly bonded oxygen of the carboxylic acid substituent. This could be the cause of the slight change.
Changes
in energy can simply be viewed by the table but for a clearer depiction of the
changes of stereochemistry before and after minimization, the two structures
must be superimposed.
Fig
6. In this image, the two structures have been superimposed. The minimized
energy
structure is the one with the carboxylic acid group pointing towards the back.
The S-naproxen structure complexed within human serum albumin and the minimized form were both superimposed onto one another using Chem 3D. By observing the superimposed images it is notable that the overall fit of both forms of the heterocompound is very good. The only exception is in the orientation of the carboxylic acid group. The minimized structure points further away towards the back of the plane whereas the complexed form is stretched towards the front. This gives a clear description for the decrease in stretch energy between the two forms of the heterocompound.
Slight deviation in the location of the singly bonded oxygen atoms is present but, as mentioned previously, most of the differences in the conformation of the two structures are present in the 6th to the 10th carbon. The weak van der Waals interaction between carbon atoms of the carbon chain most likely contributed to the varying 1,4 van der Waals energy change of the structure before and after it was minimized. Torsional strain could also be the result of interaction between the carbons closest to the carboxylic acid group and the carbons further away (slight dipole/dipole differences). This change in bond length contributed to an increase in bond angle (bend) which in turn decreased the 1,4 van der Waals interactions within this substituent.
Part II.
In part I, the potential energy surface of the heterocompound was determined in its minimized state and the conformation the compound has within human serum albumin. Changes in the structure were shown with deviations in the stretch, bend, stretch-bend, torsion, van der Waals (1,4 and non 1,4) interactions and dipole-dipole interactions. It was mentioned that interactions with other structures within the protein caused these changes. In part II, these interactions were investigated further.
Comparison
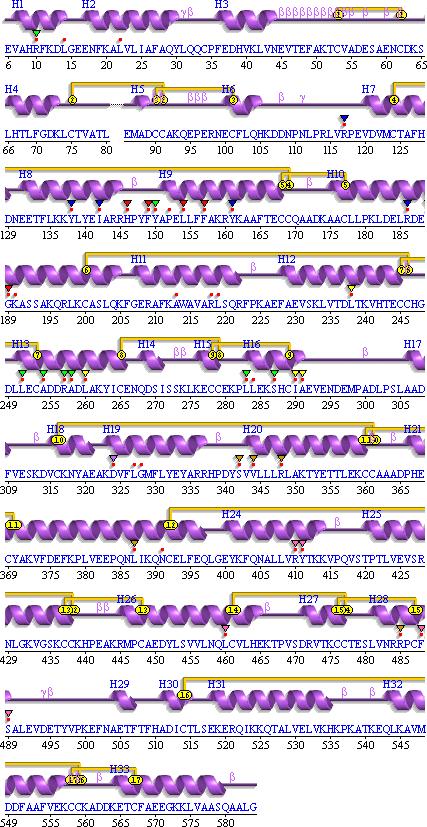
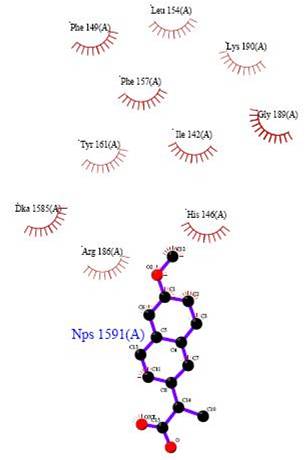
First the wiring diagram of the protein containing S-naproxen was viewed in the PDSum website [3]. The wire diagram displays the amino acid sequence within human serum albumin and highlights areas of interactions with the use of colored markers. For example a red dot indicates areas where the amino acid residues interact with the heterocompound, or ligand. Red triangles are used to mark amino acid residues that are present in the catalytic active site of the protein. The LigPlot of S-naproxen was then viewed. A LigPlot is a visual representation of the heterocompound and the compounds it interacts with, such as amino acid residues and other ligands. Interactions labeled in the LigPlot (the “eyelashes”) were then searched for in the wiring diagram to ensure that the two concurred. This was the case since every amino acid labeled as an “eyelash” in the LigPlot was marked with a red dot in the wiring diagram which indicates that the amino acid interacts with the ligand.
Fig
7. This is the wiring diagram of S-naproxen which was obtained from the PDSum
database [1]. Notice how the numbering for the red dots coincides with the
“eyelashes” on the LigPlot on page 8.
 The protein structure was opened
in DS Visualizer and the amino acid groups and heterocompound that S-naproxen
interacts were made prominent. This was done by hiding the rest of the amino
acids and heterocompounds save the ones the PDSum LigPlot identified as
interacting with S-naproxen. Every amino acid was found within the structure
just as it is mentioned in the LigPlot, however the location of a few amino acids
is a slightly off. This could simply be caused by inconsistencies with a 2D
figure to properly represent the positioning of a 3D image. This difference can
be seen in the 3D version of this image (generated on DS Visualizer) on the
next page.
The protein structure was opened
in DS Visualizer and the amino acid groups and heterocompound that S-naproxen
interacts were made prominent. This was done by hiding the rest of the amino
acids and heterocompounds save the ones the PDSum LigPlot identified as
interacting with S-naproxen. Every amino acid was found within the structure
just as it is mentioned in the LigPlot, however the location of a few amino acids
is a slightly off. This could simply be caused by inconsistencies with a 2D
figure to properly represent the positioning of a 3D image. This difference can
be seen in the 3D version of this image (generated on DS Visualizer) on the
next page.
Fig
8. This is the LigPlot for S-naproxen obtained from PDSum [9]
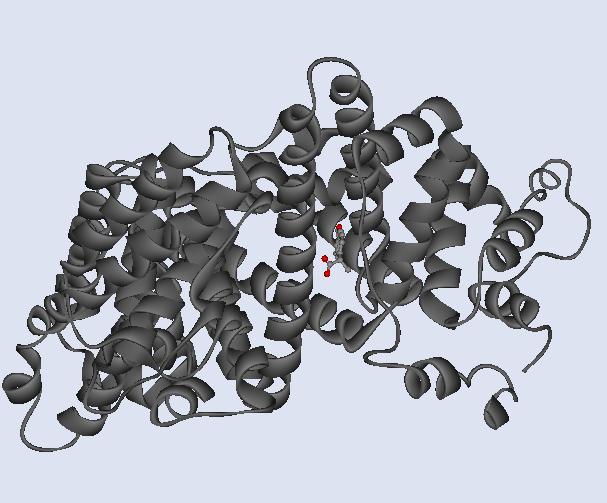
Fig 9. This is simply a depiction
of S-naproxen in a ball-and-stick rendition and HSA in the solid ribbon
rendition

Fig 10. This is the
heterocompound in a ball and stick rendition within HAS
 fig 11. This is a 3D version of the LigPlot generated
in Chem 3D using. S-naproxen is rendered in the ball-and-stick style and the
amino acid residues and DKA (decanoic acid, a heterocompound) with which it
interacts are rendered in the stick style, colored pale yellow.
fig 11. This is a 3D version of the LigPlot generated
in Chem 3D using. S-naproxen is rendered in the ball-and-stick style and the
amino acid residues and DKA (decanoic acid, a heterocompound) with which it
interacts are rendered in the stick style, colored pale yellow.
Another inconsistency can be noted in this extracted version of the heterocompound and ligands that it immediately interacts with: The LigPlot makes no mention of hydrogen bonds since all interacting amino acids are represented with eyelashes whereas the 3D diagram in DS Visualizer does. It is a curious matter since some atoms seem as if they would form a hydrogen bond with the electronegative carboxylic acid of S-naproxen (such as ILE 142 directly on top of S-naproxen, or DKA 1585 directly to the left of S-naproxen) however the diagram and LigPlot suggest otherwise. Nevertheless, the interactions of these ligands with the heterocompound are discussed in a table on the next page based on the given results.
Table 2: Protein-Ligand
Interactions between S-naproxen and HSA
|
Amino Acid Residue |
Heterocompound Atoms |
Nature of Interaction |
|
|
Leu154 |
Side chain, aliphatic |
Isopropyl group of Leu with carboxylic acid of NPS |
Hydrophobic attraction of weak positively charged Leu with the carboxylic acid group of NPS |
|
Phe 149, 157 |
Aromatic side chain |
Methoxide group , benzene groups of Phe. |
The electronegative oxygen of the methoxide group forms a hydrophobic attraction with both phenyl groups. |
|
Lys 190 |
Side chain, Aminium ion |
Methyl group with methoxide of NPS. |
Slightly (+) methyl group of Lys side chain forms an electrostatic attraction to (-) charge |
|
Phe 157 |
side chain, aromatic |
Phe forms a hydrogen bond with Tyr (Phe being the HBA) which interacts with the π -bonds of NSA |
Hydrophobic attraction of π bonds with NSA |
|
Gly 189 |
Side chain, aliphatic |
??? |
Hydrophobic attraction. Gly is a HBD to Arg186 which gives Gly a slightly positive charge. Therefore there could be electrostatic attraction between the (+) Gly and (-) methoxide of NPS |
|
Ile 142 |
Aliphatic, side chain |
??? |
Hydrophobic attraction is possible, perhaps due to electrostatic attraction |
|
Tyr 161 |
Aromatic, side chain |
??? |
Hydrophobic, attractive π –interaction possible: Alcohol group of Tyr could have a weak interaction with the methoxide of the NSA side chain |
|
DKA 1585 |
Aliphatic, backbone |
??? |
DKA is a type of fatty acid which usually forms a hydrogen bond with electronegative S-naproxen [8] but does not in the diagram, perhaps there is an electrostatic attraction between the backbones of both structures |
|
His 146 |
Aminium ion, backbone |
NH+ of His |
Electrostatic attraction: Carboxylic acid group of NPS forms an attraction with the NH+ of His |
|
Arg 186 |
Aminium ion, backbone of NPS |
(CN3H5)+ of Arg |
Hydrogen bonding, H of Arg is a HBD and NPS is the HBA |
Bear in mind that some bonding may also occur with ligands contained within HSA that are not represented in the LigPlot. The next diagram depicts the location of the ligands and heterocompounds relative to the protein, HSA.
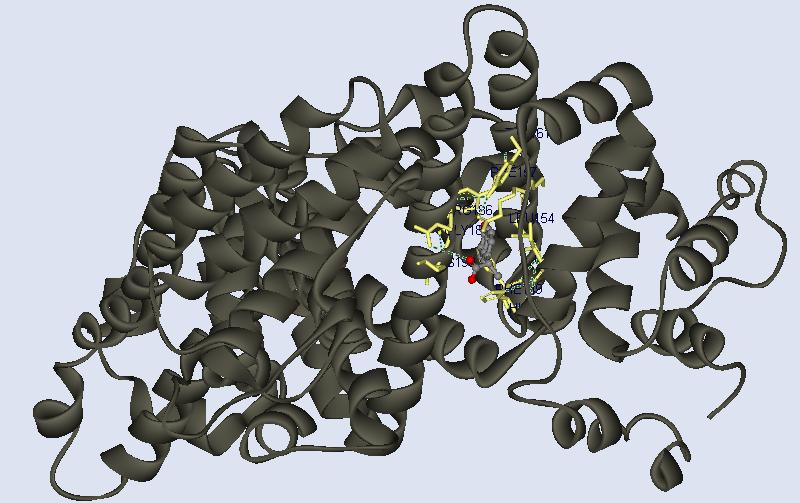 fig 12. This is a bottom view of HSA in solid ribbon
form. The heterocompound is in a ball and stick rendition and the ligands it
interacts with are colored yellow, in a stick rendition.
fig 12. This is a bottom view of HSA in solid ribbon
form. The heterocompound is in a ball and stick rendition and the ligands it
interacts with are colored yellow, in a stick rendition.
References:
[1]
A. Yamaguchi, K. Iida, N. Matsui, S. Tomoda, K. Yura, M. Go: Het-PDB Navi. : A database for protein-small molecule interactions. J. Biochem (Tokyo), 135, pp.79-84 (2004)
[2]
Lejon, S., Cramer,
J.F., Nordberg, P.A. ![]() (2008)
Structural Basis for the Binding of Naproxen to Human Serum Albumin in the
Presence of Fatty Acids and the Ga Module.
(2008)
Structural Basis for the Binding of Naproxen to Human Serum Albumin in the
Presence of Fatty Acids and the Ga Module. ![]() Acta Crystallogr.,Sect.F
Acta Crystallogr.,Sect.F ![]() 64: 64
64: 64 ![]()
[3]
S.Lejon et al. (2008). Structural basis for the binding of naproxen to human serum albumin in the presence of fatty acids and the GA module.. Acta Crystallogr Sect F Struct Biol Cryst Commun, 64, 64-69. [PubMed id: 18259051] [DOI: 10.1107/S174430910706770X]
(abstract only, see [8])
[4]
Chem 3D Help, “Compute Properties.”
[5]
"Naproxen." AHFS Consumer Medication Information. 2009. American Society of Health-System Pharmacists. 4 May 2009 <http://www.ncbi.nlm.nih.gov/bookshelf/br.fcgi?book=meds&log$=drug_bottom_one∂=a681029>.
[6]
Block Drug Co., Inc., Jersey City, NJ 07302; Hazleton Laboratories America, Inc., Vienna, VA 22180; Department of Pharmaceutical Sciences, College of Pharmacy and Allied Health Professions, St. John's University, Jamaica, NY 11439 [DOI: 10.1002/jps.2600770314]
[7]
MedInnovation GmbH: function of Human Serum Albumin. Retrieved May 4, 2009, from http://www.medinnovation.de/background/hsa.htm
[8]
For Full Text
Article:
S.Lejon et al. (2008). Structural basis for the binding of naproxen to human serum albumin in the presence of fatty acids and the GA module.. Acta Crystallogr Sect F Struct Biol Cryst Commun, 64, 64-69. [DOI:10.1016/j.physletb.2003.10.071]
[9]
PDBSum: HSA complexed with S-naproxen structure. Retrieved May 5, 2009, from http://www.ebi.ac.uk/thornton-srv/databases/cgi-bin/pdbsum/GetPage.pl?pdbcode=2vdb&template=main.html