Water That Stands Up
Barry A. Klinger
George Mason University
Atmospheric,
Oceanic, and Earth Sciences Dept.
 One of the strangest effects of the rotation of the Earth is that it
allows water to defy gravity. This is due to the Coriolis
effect: whenever an object moves, the Coriolis force pushes
sideways (to the right in the northern hemisphere, left in southern).
One of the strangest effects of the rotation of the Earth is that it
allows water to defy gravity. This is due to the Coriolis
effect: whenever an object moves, the Coriolis force pushes
sideways (to the right in the northern hemisphere, left in southern).
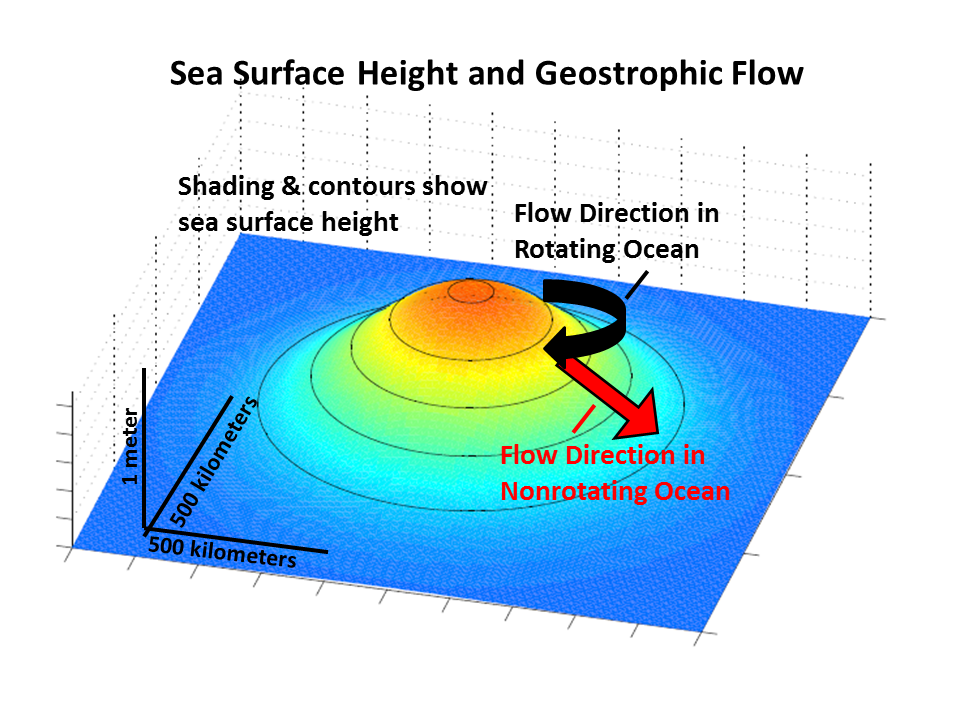
Suppose the surface of the ocean was distorted somehow so that water
was piled into a mound or hill. Our intuition, based on seeing water
that is moving too quickly to be affected by the Coriolis force, is
that the water would flow "downhill". This way the mound would
flatten out because of gravity. However, if the mound is so wide that
it takes more than a day for the water to flow all the way down the
mound, then the Coriolis force makes it go around the mound
instead.
The same phenomenon explains why the wind whips around a low-pressure
zone such as a hurricane instead of just being sucked into the low.
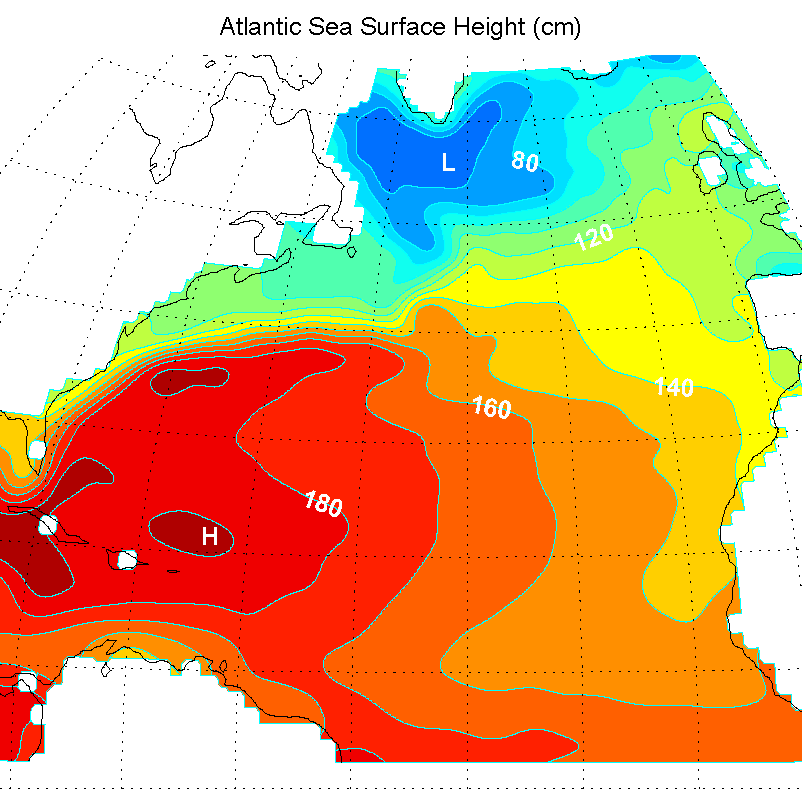 Satellites can actually measure the sea
surface height by bouncing radar signals off the surface. The figure
at right shows the sea surface height (SSH) in the North Atlantic
Ocean (America is on the left, Europe and Africa on the right edge of
chart). The Atlantic Ocean has water piled up nearly 2 meters high
(shown in red) off the coast of Florida, and there is a depression
(shown in blue) in the sea surface between Canada and Greenland in the
North. The sharp boundary between high and low water off the
southeast US marks a strong current: the Gulf Stream.
Satellites can actually measure the sea
surface height by bouncing radar signals off the surface. The figure
at right shows the sea surface height (SSH) in the North Atlantic
Ocean (America is on the left, Europe and Africa on the right edge of
chart). The Atlantic Ocean has water piled up nearly 2 meters high
(shown in red) off the coast of Florida, and there is a depression
(shown in blue) in the sea surface between Canada and Greenland in the
North. The sharp boundary between high and low water off the
southeast US marks a strong current: the Gulf Stream.
There is a direct relation between the sea surface slope and
how fast the water is going. This is confirmed by the figure below.
Both panels use arrows to estimate direction and magnitude of the
surface velocity in the North Atlantic Ocean. The chart on the left
calculates the velocity from the slope of the sea surface. The chart on
the right calculates velocity by observing the location of drifters
floating in the ocean. The two pictures are very similar even though
they were created using completely different data and methods.*
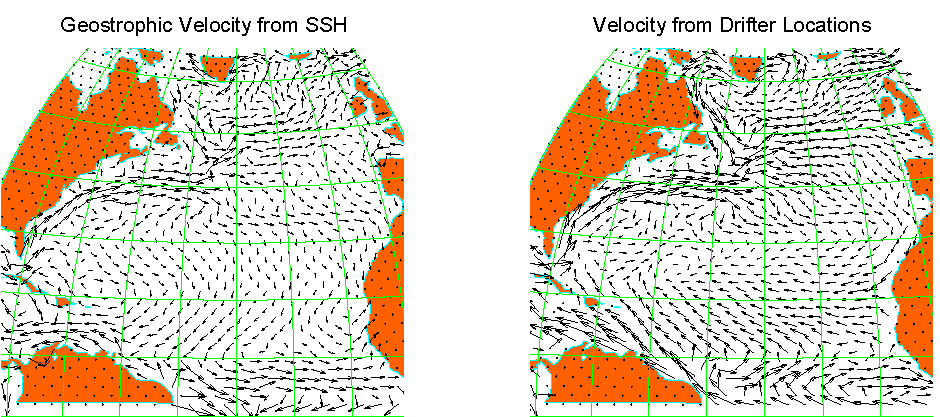
*There are some other effects associated with wind pushing on the
water which alter the two estimates of velocity, especially in the tropics.
References: SSH from 2006-2009 AVISO data, surface data
Lumpkin and Giraffo (2005), both data sets smoothed with 3 degree wide
averaging.
Last modified: 25 March 2015