How Much Colder Was Houston This Year?
Barry A. Klinger, 19 February 2021
Return to Local Weather and Climate

Texas experienced a humanitarian disaster this week when cold temperatures crippled the Texan electricity grid, leaving millions to face the cold in dark, unheated houses. How unusual were the low temperatures this year? Here I put this week's temperatures in a climatological context for Houston.
A Look at the Record
The figure above shows 30 years (light blue) of daily low temperatures (1990-2019) for January and February, as well as this year's lows (dark green) up to February 16 (Tuesday this week). The daily temperatures are plotted so that the roughly 60 days of Jan-Feb take up 2/3 of a year on the graph. The blue, black, and gray curves show coldest, 3rd coldest, warmest, 3rd warmest, and median temperatures for January-February of each year. Daily lows typically occur at night, but daytime temperatures, though a bit warmer, show a similar pattern.
This data shows that
- Houston can be pretty warm in winter, hitting 56o or higher most years.
- Houston can also be pretty cold, with median temperatures in the 40s, and annual minimum Jan-Feb temps often in the 20s.
- This year's temperatures hit 13o, 6o lower than any other years in the 30 year climatology.
These features can also be seen in another look at the same data, plotting temperature as a function of date for all years.

Temperature Distributions
Another way of comparing the temperatures is to look at the distribution of values over the full 30 year period. Ordering coldest, 3rd coldest, and median days of Jan-Feb of each year from coldest to warmest (left panel of figure blow), we can see that the lowest minimum was less than 26o for about 1/3 of the years, above 31o for another 3rd, and inbetween for the rest.
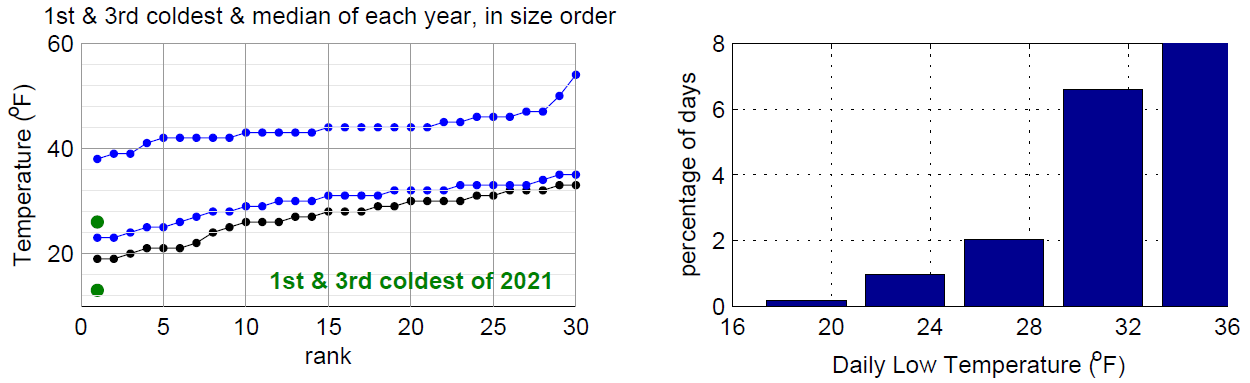
Rather than just looking at minimum values, what is the distribution of all cold days in Jan-Feb? The panel on the right shows what fraction of the total number of days (approximately 30 years X 60 days/year = 1800 days) are in each of several 4o-wide bins. Each bin has 2-4 times fewer days as the next warmer one. If a similar magnitude drop-off occurs from the 17-20o bin (3 days) to the 13-16o bin, that implies a good chance of around 1 day of daily lows below 17o in a thirty year period.
The Verdict
The 30 year climatology showed that temperatures as low as Houston has seen this week are extremely rare but certainly within the realm of possibility in any given decade. It was not reasonable to assume that such temperatures could not occur.
Data Source
Observations can be found at National Centers for Environmental Information, where you can search station data for "HOUSTON INTERCONTINENTAL AIRPORT TX, US, GHCND:USW00012960."
Last modified: 19 February 2021