Hot Days and Hotter Nights in DC
Barry A. Klinger, Summer 2019
Return to Local Weather and Climate

How Many Hot Days a Year?
While hiding indoors from the scorching heatwave broiling the DC area and much of the nation, I compiled some local measurements of temperature over the years. All data is from Washington National Airport (DCA), which is not in DC but just across the river in northern VIrginia. The data includes daily maximum temperatures from the sixty years up to 2018. I will wait till summer is complete before adding 2019 data.
One way of measuring extreme heat is to record how many days reached temperatures above a given benchmark. The plots show the number of days going above 80, 85, 90, and 95 °F in a given year. Each bar represents the average over a ten year period, 1959-1968, 1969-1978, etc.
The plot on the far right combines numbers for all four benchmarks: almost a third of the year reaches above 80 degrees virtually every year in DC. About a month's worth of days pass 90°, and a handful of days pass 95° each year. The plots on the left show the temperature categories individually to highlight the details. Perhaps the most striking feature is that the number of days above each temperature has increased over the course of sixty years. According to a linear least squares fit, every decade brings roughly an extra day of hot weather as measured by all four threshhold temperatures. For days above 95°F, that represents a doubling of the number of hot days over 60 years.
Is it Really Getting Hotter?
The graphs also include r2, the coefficient of determination, which measures the fraction of variance explained by the linear fit. An r2 of at least .5 starts to be interesting, but this is only attained by the 95 degree threshhold. The r2 for the others suggest that the increase may be a fortuitous result of essentially random variation. Still, it is interesting that all four measures show an increase.
Generally speaking, we expect the number of hot days to increase as a result of global warming. Though this is certainly true over the world as a whole and for large regions, it is harder to detect the global warming signal at a single location, which is heavily influenced by random variation unrelated to the longterm upward trend in global temperature.
Actually It's The Hot Nights
Effects of global warming may be clearer in the daily minimum temperatures rather than daily maximum.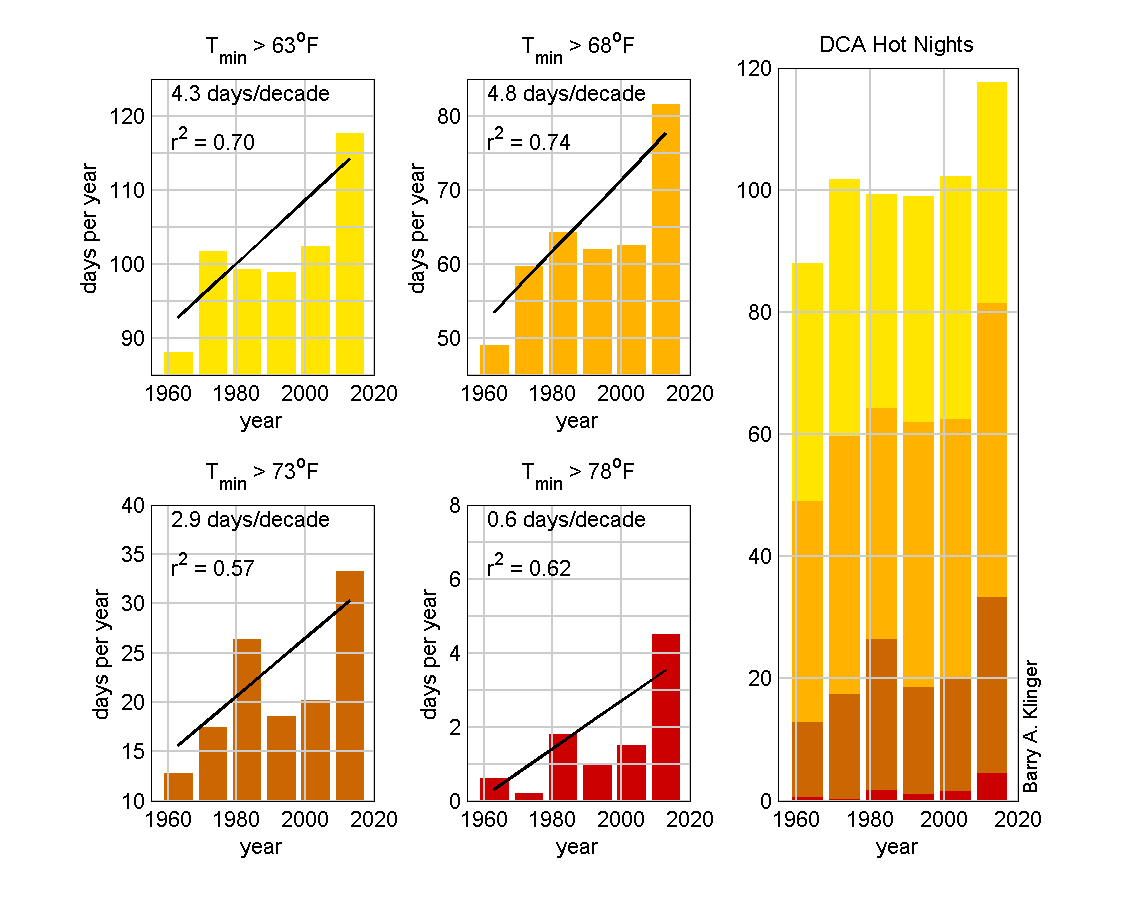
The daily minimum temperature has been undergoing a much larger increase in the number of nights above various threshhold values. The number of nights surpassing 63, 68, and 73°F have been increasing by 3-5 days every decade. The number of miserable nights never going below 78°F has gone from an average of less than 1 per year to almost 5 per year. In all cases, an r2 > .50 indicates a more statistically robust result.
We should exercise some caution in linking even this clear trend to global warming. Another possible cause is an increase in the urban heat island affect. The population of Virginia, much of it in the DC Metro area, has doubled over the last 60 years, and more of the local surface is covered with the pavement and buildings that cause the urban heat island. Most likely the observed trend at DCA is some combination of these local effects and global warming.
Data Source
Observations can be found at National Centers for Environmental Information, where you can search station data for "Washington Reagan National Airport, VA, US, GHCND:USW00013743."
Last modified: 21 July 2019