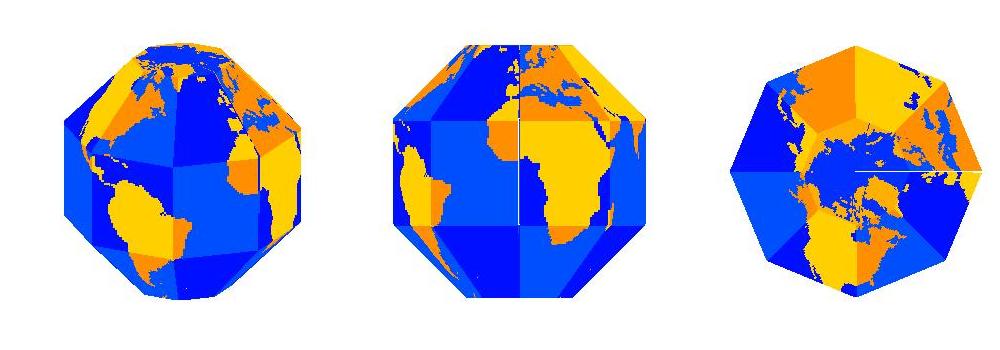
Illustration of Octaglobe Sector Globe; colors show faces of polyhedron and location of land and sea.
Illustration of Octaglobe Sector Globe; colors show
faces of polyhedron and location of land and sea.
Earth scientists (including geophysicists, atmospheric scientists, oceanogaphers, and climate scientists) and geographers routinely plot large-scale features of the Earth. Projecting these on to a flat surface such as a computer screen or paper inevitably distorts areas, directions, or both. In addition, such projections always have edges, but the real world does not. Areas that are relatively close on the Earth appear far away on the map.
The most accurate representation of the surface distribution of properties is a globe. However, it is difficult to construct globes and so researchers, educators, and students usually make do with a fairly small number of globes which are available for purchase. There is an unlimited number of properties which could be usefully viewed as a globe but which are not available. A few examples include temperature, biomes, previous locations of continents due to plate tectonics, and ocean and atmospheric circulation.
One geometric property that makes globes difficult to construct is the fact that a flat surface can not be rolled or bent into a sphere. This impedes efforts to print out computer-generated maps for use on a globe. However, a sphere can be approximated by a polyhedron. A polyhedron has the advantage that it consists of flat surfaces which can be generated by a computer with a printer. With a relatively small amount of effort, one can cut, fold, and tape (or glue) the edges of the projection to construct a polyhedron out of paper.
Typical examples of polyhedral globes can be seen in Fig 8 of van Wijk (2008, The Cartographic Journal, 45, 32-42). These shapes, including an octahedron (8 triangular faces) and dodecahedron (12 pentagonal faces), do not align comfortably with the latitude-longitude system usually used to locate objects on Earth. Lat-lon coordidnates are useful not only because they are a conventional way of finding locations. Latitude also represents a physical property of the Earth - distance from the spin axis of the planet - which helps determine the amount of sunlight a location receives. This in turn has consequences for climate, ecology, etc. The latitude also determines the local behavior of the Coriolis Force which is important in meteorology and oceanography.
Because the faces of the Sector Globe are aligned with latitude and longitude, the Sector Globe provides an easy orientation for interpreting physical characteristics of the globe and for relating properties on the globe to flat maps which are based on lat-lon.
A different approach to the problem of map projections is to create a dynamic 2D image of a 3D globe, such as Google Maps, which can be rotated and otherwise manipulated on the computer. Physical globes such as the Sector Globe are a complement to, rather than a replacement of, such cyber maps. The advantages of a cyber globe are flexibility and accuracy. A physical globe has advantages of being relatively permanent (one can place it on a desk or shelf and look at it as needed). I've already had the experience of picking up the bathymetric globe sitting on my desk to make a point about Atlantic Ocean bathymetry while discussing research results with a graduate student. The action of touching it, picking it up, and turning it around in one's hands may make it easier to pay closer attention to its features. Having students construct the globe themselves may reinforce this attention (the design of the globe is also a nice exercise in geometry and trigonometry). In the same vein, in our internet-saturated culture, a physical globe may capture some students' attention more than yet another computer animation. In the past, slick computer graphics had a certain novelty value, but increasingly it is the old-fashioned physical object which is the novelty!
Last modified: 28 June 2012