The 2017 gubernatorial Virginia election map, showing a sea of Republican red with a few isolated islands of Democratic blue, might make you wonder how Ralph Northam (D) actually beat Ed Gillespie (R). Of course the geographical map does not indicate the great disparity in population between such places as Fairfax County (372,000 votes for the two candidates) and Halifax County (20,000 votes). The map below presents the county election data in a way that emphasizes population rather than land area.
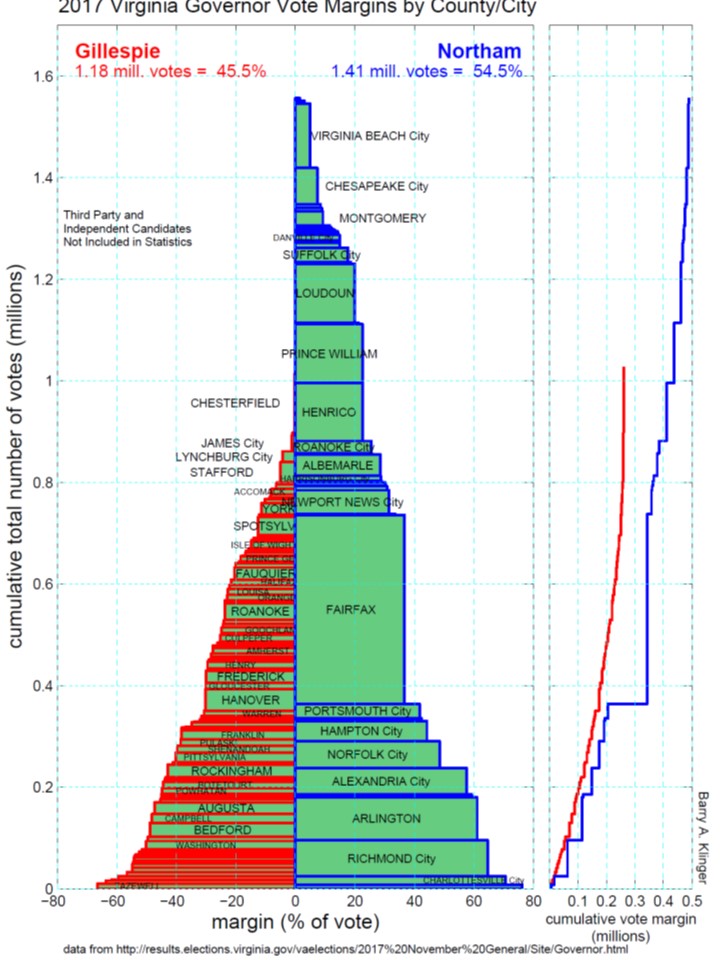
Each box in the figure represents the election results from one Virginia county or city. Gillespie won in each county/city in the stack on the left and Northam won in those on the right. The width of a box represents the percentage margin of victory, and the height represents the total number of votes cast for the two candidates. Thus in Fairfax, Northam got nearly 40% more votes of the nearly .4 million cast. This shows both the intensity of the victory and its contribution to the state total, since a taller box has a greater impact on the election than a shorter one. The area of the box tells the size of the margin in number of votes. For more on using this kind of graph to analyze elections, see The 2016 Presidential Election
This figure illustrates the fact that Northam won by huge margins in large-population places like Fairfax, Arlington, and Richmond and by large margins in other populated areas such as Loudoun, Prince William, and Henrico counties. In contrast, Gillespie won many sparsely populated counties. The total height of each column represents the total number of votes (for both candidates) of cities and counties that went for each candidate: over 1.5 million voted in Northam-leaning places and about .9 million in Gillespie-leaning areas.
A plot of cumulative votes (to the right of each margin-population chart) shows the combined impact of the counties voting for each candidate. In these plots, one stairstep curve shows the performance of each candidate, the vertical axis is the total number of votes (as in the other chart) and the horizontal axis is the cumulative number of excess votes for the candidate. The topmost value of each curve shows the total population voting in all the counties in which the candidate won (vertical axis) and the sum of all the margins (horizontal axis). The difference between the sum of margins for each candidate gives the state margin.
Page Created: 8 November 2017.