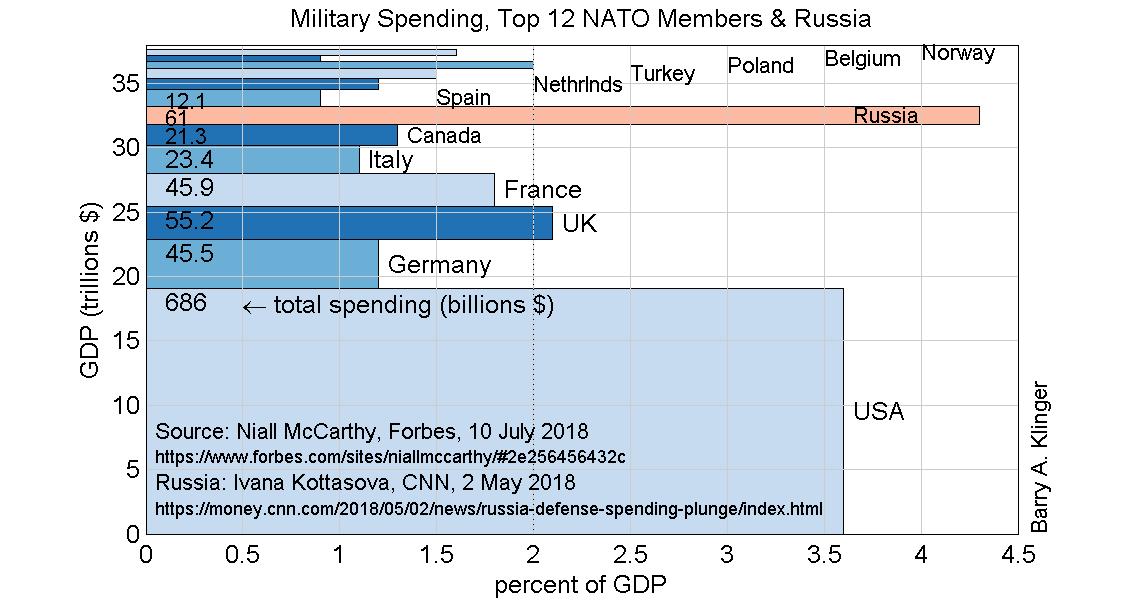
Since at least 2014, successive US presidents have been trying to get countries in the North Atlantic Treaty Alliance (NATO) to spend at least 2% of GDP on their military. Recently there has been debate over the relative size of the military contribution of the US and its NATO allies. In the chart below, each rectangle represents an individual nation, with rectangle width showing spending as a percentage of GDP and rectangle height showing the nation's total GDP. Thus the rectangle's area represents the nation's military spending, which for the highest-spending nations is also printed as a number on the rectangle. This chart was inspired by a comparison of total spending produced by Niall McCarthy in Forbes Magazine.
It is important to remember that the figures do not represent contributions to NATO by member states, but include all military spending by each country. Much US spending is not specifically for NATO.
The chart shows how the US spends a considerably larger percentage of its GDP on the military than the other NATO allies, and that only Britain, France, and Poland are at about 2% of GDP (some smaller countries not shown on chart are also higher). The contribution of the United States to the sum of all the allies military spending is bigger than the percentages would suggest because of the relatively high GDP of the US, which is largely due to the US's large population. Still, the next 11 biggest military spenders in NATO collectively spend somewhat over one third of what the US does even though the sum of their GDP's is similar to that of the US.

Russian spending, in comparison, is a larger percentage of GDP than even the United States, but because of its small GDP, the military budget is not large. In the case of Russia, the small GDP reflects a small per capita income rather than a small population. While Russian spending is paltry compared to the US or the sum of European NATO members, lower costs for personnel and equipment allow it to have a relatively large number of soldiers and advanced equipment (including nuclear weapons, submarines, military jets, tanks and artillery).
Interpreting these numbers is complicated, since (for example) American military force has a global mission with large commitments in East Asia and elsewhere, whereas other NATO members are more focussed on Europe. However it serves as a starting point for comparing the spending among nations.
Last modified: 13 July 2018.