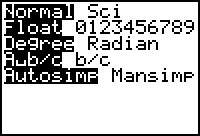
The first three instructions should be followed each time you start an activity in your TI-73.
 |
1. Setting MODE: Press MODE. To select an option, arrow to each option and press ENTER to highlight. |
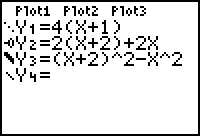 |
2. Turning off Graphs and Plots: Press Y=. If you see and equal signs or Plots highlighted, arrow to the highlighted area and press ENTER to turn off graphs and plots. |
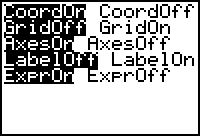 |
3. Setting the Graphing Window Format: Press 2nd FORMAT and make your screen look like the one shown. You might want to choose other options. |
We have to keep track of three nutrients, Fat, Carbohydrate, and Protein. We will create a Category List on the TI-73.
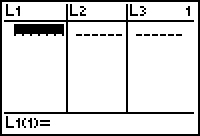 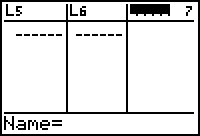 |
4. Press LIST. Arrow up to the list names and then arrow over until you get to a blank list. Notice that the small number 7 on the second screen indicates you are in the 7th column. |
Note: Your list editor might not look like these screens. This can cause confusion in a class. From the home screen, you could press 2nd CATALOG, go to SetUpEditor, press ENTER and then ENTER. Press LIST to get back into the list editor.
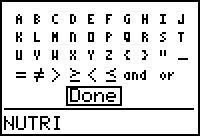
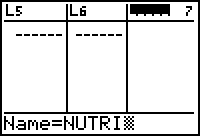
5. Press 2nd TEXT. Let's name the list NUTRI. Arrow to each letter, press ENTER, and final arrow to Done when you are finished. The screens are shown in sequence below.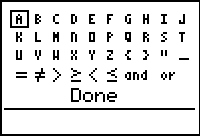 |
 |
 |
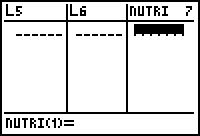 |
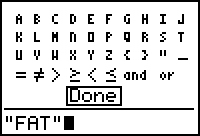
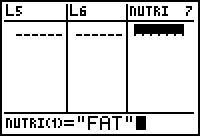
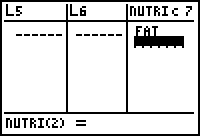
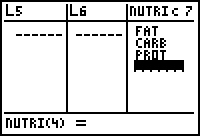
6. Defining a Category List: Press 2nd TEXT. To name the first element of the list "FAT" we need to use " marks around the name to tell the TI-73 that this is a category list. You only have to use " marks for the first entry. After you finish "FAT" press ENTER ENTER. Notice that there is a c in the list. This indicates a Category List. Follow the screens below. Repeat this to fill in the entries CARB and PROT.
 |
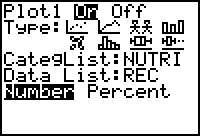
 |
 |
 |
Classroom Note: Everyone should learn how to enter lists. To save time for the next lists, the instructor could have the list on their calculator and then link and send the lists to the students. (See Guidebook for instructions.)
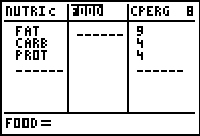 |
7. Create a list called FOOD and a list called CPERG
(Cal/gram). The Calories per gram are given at the bottom
of the Nutrition Label. Enter these values, in Calories per
gram, in CPERG as shown.
Fat - 9 C/g; Carbohydrate - 4 C/g; Protein - 4 C/g |
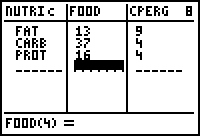 |
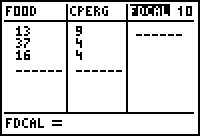
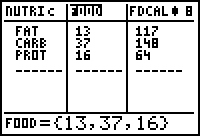
8. Next, enter the number of GRAMS for each category in FOOD. Get this information from the Nutrition Label. |
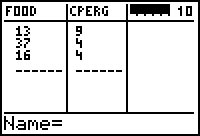
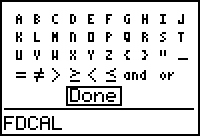
9. Highlight a list name and arrow over to an empty list. Name the list FDCAL for food calories.
 |
 |
 |
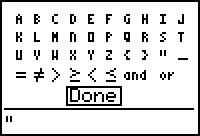
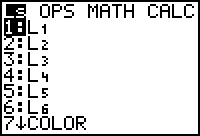
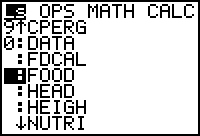
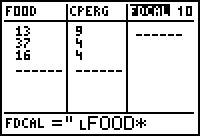
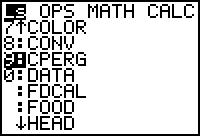
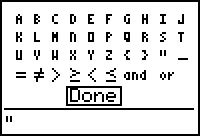
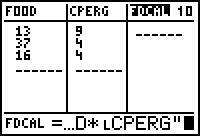
10. In Table 1, Part 1, you calculated the pizza calories by multiplying the grams of a nutrient by the Calories per gram. The next screen take you through entering a locked list. We will set up the FDCAL = "FOOD*CPERG" The quote marks lock the list. Notice the small diamond that appears next to the FDCAL name. Now, any time you change FOOD, this list will update.
 |
 |
 |
 |
| 2nd TEXT, ENTER. | 2nd LIST | Arrow to name, ENTER | Press x |
 |
 |
 |
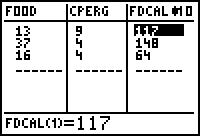 |
| 2nd LIST, ENTER. | 2nd TEXT, ENTER. | ENTER | FDCAL is locked! |
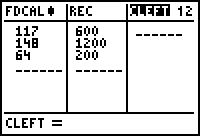
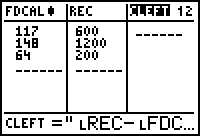
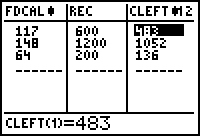
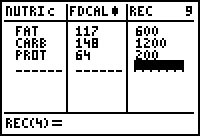
11. Next, repeat this procedure using the information above to enter CLEFT (Calories left to eat). Create the locked list CLEFT = "REC-FDCAL" Notice the small L that appears when a list name is pulled up! This is our final column from Table 1. WHEW!!!
 |
 |
 |
  |
12. To organize the lists so that you can see the lists you want to compare, just delete some lists from the editor. This will not delete the list. This just deletes the list from being seen in the editor! We just want to compare the nutrients through a comparison of calories. Highlight the list name FOOD and press DEL. Highlight the list name CPERG and press DEL. You should only see NUTRI, FDCAL, REC. |
13. We get a better picture of the numbers if we change the number to percent of the total Calories. You can do this in the list editor but we need to first know what math we would like to "do" before we can set up lists. Fill in the table below with the % of total Calories. Write an explanation of how you filled out columns B and D. Also explain the Totals.
| A | B | C | D | |
| Pizza (g) | % of Total Pizza Calories | Recommended Daily Intake | % of Total Recommended Calories | |
| Fat | 117 | 600 | ||
| Carbohydrate | 148 | 1200 | ||
| Protein | 64 | 200 | ||
| Totals |
14. If you eat pizza all day, how many pieces can you eat and still stay within the FDA recommendations? Write the math!
15. Draw a pie chart for the piece of pizza and for the FDA recommendations.
 |
 |
|
|
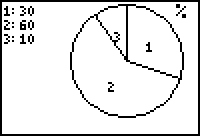
16. Setting Up Pie Charts: It might be hard to see if the calories in a slice of pizza are in the same balance as the recommended calories for the day. We can use pie charts or circle graphs to see how the Calories of the nutrients in the pizza compare to the Calories of the nutrients recommended for the entire day. We see that representing the numbers as the percent of the total helps! If we want to analyze an entire day of food, calculating and drawing many circle graphs is not efficient! Let's have the TI-73 do the job!
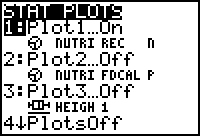
17. First, draw the circle graph for the FDA Recommendations:
 |
 |
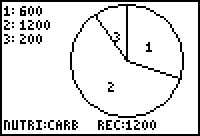 |
| 2nd PLOT | Press 1: Plot1 | Press GRAPH, then TRACE and arrow around! |
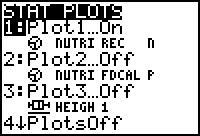
Hint: Use 2nd STAT to find the list names.
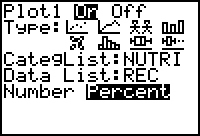
We would like to compare the percentage so we need to redraw this circle with the percent option. Notice you go through the same keystrokes as above except you set the option of Percent!
 |
 |
 |
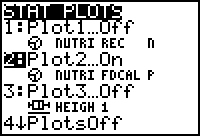
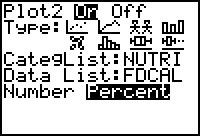
18. Now set up the pie chart for the slice of pizza. Press TRACE to see the three nutrients!
 |
 |
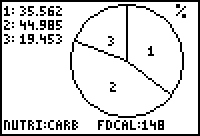 |
19. Do these graphs agree with your graphs? Can you eat pizza all day?
20. Congratulations! You are now ready to plan your meals for the day!
Extension Questions:
30% - Fat 60% - Carbohydrate 10% - Protein
Back to the Introduction! |
 |
Margo Lynn Mankus |
 1998 by
Margo Lynn Mankus