Lichen communities in the NCR
A total of
45 macrolichens and three lichen-associated parasites was
observed in the permanent plots established during the study (Table 1). These
species make up epiphytic macrolichen communities typical of the midatlantic
region at the present time.
- Many of the dominant species
are nitrophilous and/or pollution-tolerant (Punctelia rudecta,
Flavoparmelia caperata, Myelochroa aurulenta, Physcia spp. and Phaeophyscia
spp., Pyxine sorediata), and they have likely dominated lichen
communities in the eastern United States for much of
the past century.
- When comparisons can be made (see floristic data
for Plummers Island, CHOH09), present-day communities are less
diverse and contain fewer sensitive species than communities that
existed at the same sites in the past century.
- Certain lichens found only in
CATO are typical northern and mountain species.
- Communities in the
parks closest to the center of Washington, D.C. (NAMA, NACE) had the
fewest species with the lowest abundance scores. These communities were
made up mostly of pollution-tolerant, nitrophilous species (Physcia
millegrana, Punctelia rudecta, Flavoparmelia caperata, Phaeophyscia
rubropulchra).
- Pollution
sensitive species are uncommon, but found throughout the study area
(Tables 1 and 2).
Table 1. Summary of macrolichen collections made in each of the nine park
units participating in the study. A link to the species lists and abundance
scores is available for each entry.
|
|
Total species
|
Sensitive species
|
Notes
|
|
CATO
(25 plots)
|
26 macrolichens, 2 lichenicolus parasites
|
Cetrelia olivetorum, Collema furfuraceum, Leptogium cyanescens
|
Mountain flora (northern Allocetraria
oakesiana and western Flavopunctelia soredica); Peltigera canina collected
off-frame.
|
|
CHOH
(10 plots)
|
20 macrolichens, 2 lichenicolus parasites
|
Coccocarpia palmicola
|
Historical floristic
data available for Plummers Island, Maryland (CHOH09).
|
|
GWMP
(5 plots)
|
15 macrolichens, 0 lichenicolus parasites
|
Usnea sp.
|
Historical collections from Great Falls, Maryland, available in the
U.S. National Herbarium.
|
|
HAFE
(5 plots)
|
12 macrolichens, 0 lichenicolus
parasites
|
None
|
|
|
MANA
(4 plots)
|
20 macrolichens, 0 lichenicolus parasites
|
Leptogium cyanescens, Parmelia
squarrosa, Tuckermannopsis ciliaris
|
|
|
NACE
(5 plots)
|
10 macrolichens, 0 lichenicolus parasites
|
None
|
Tolerant nitrophilous species dominant
(Physcia millegrana, Candelaria concolor, Punctelia rudecta).
|
|
NAMA
(1 plot)
|
6 macrolichens, 1 lichenicolus parasite
|
None
|
Tolerant nitrophilous species dominant
(Physcia millegrana, Candelaria concolor, Punctelia rudecta).
|
|
PRWI
(44 plots)
|
30 macrolichens, 0 lichenicolus parasites
|
Leptogium cyanescens, Parmelia
squarrosa, Tuckermannopsis ciliaris, Usnea ceratina
|
Collema furfuraceum, Peltigera canina collected off-frame.
|
|
ROCR
(3 plots)
|
10 macrolichens, 0 lichenicolus
parasites
|
None
|
Historical collections available in
the U.S. National Herbarium.
|
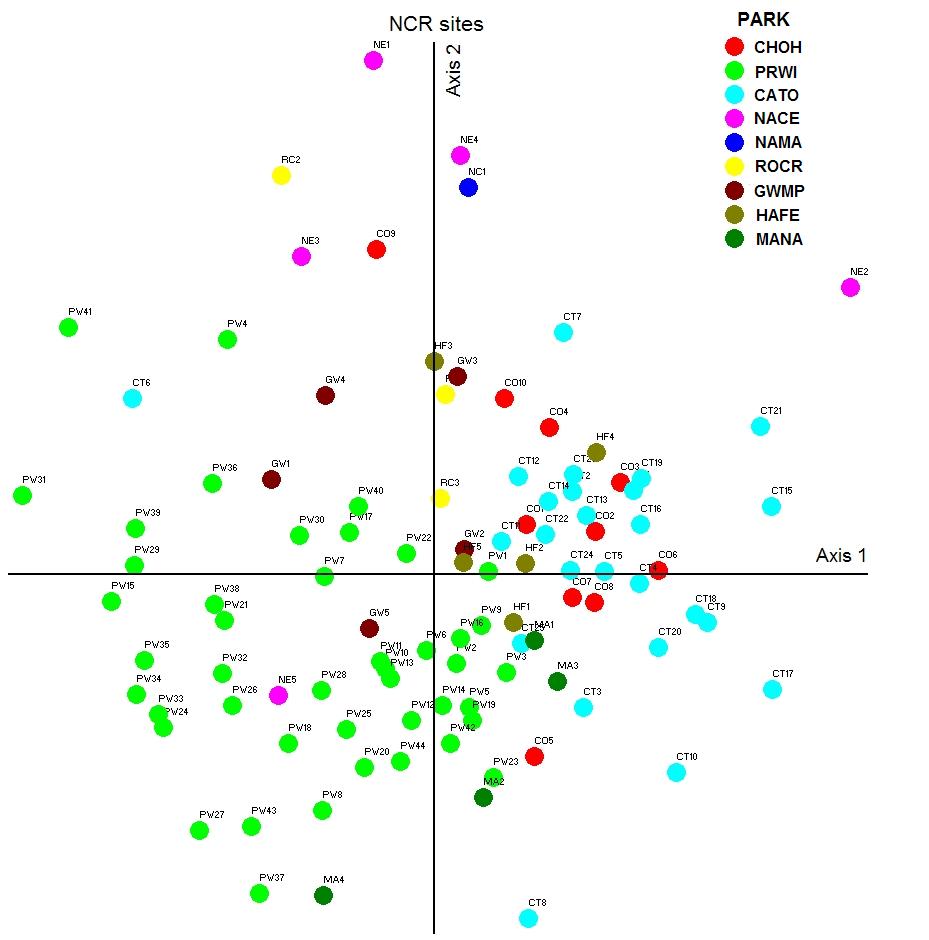
Ordination of sites based on floristic data
Nonmetric
multidimensional scaling revealed significant patterns in the floristic data
(Figure 1). Lichen communities in PRWI and CATO are especially distinct, with
each having species not found in the other parks. Other parks are
intermediate in floristic composition. This likely reflects differences in
their geographic locations (axis 1), but may also indicate effects of past
pollution. Communities of the three most urban parks (NAMA, NACE, ROCR) are
also distinct, likely a reflection of their low diversity (axis 2).
Integrating floristic data in this way provides a basis for comparison in the
future.
Figure 1. NMS ordination of lichen
floristic data obtained at each of the 102 plots established in the NCR.
Indicator species in the NCR
Table 2. Certain species of
lichens collected in the NCR study have been tentatively assigned to
indicator categories based on published reports. These categories include the
indicator and functional groups listed above. It should be noted that a specific lichen may be assigned to more than one
grouping. (Key: S = sensitive; T = tolerant; N = nitrophilous; A =
acidophilous; C = cyanolichen; para = lichenicolous fungi):
|
Allocetraria oakesiana S
|
Heterodermia speciosa
|
Parmotrema stuppeum
|
Punctelia rudecta NT
|
|
Anaptychia palmulata
|
Hypotrachyna livida S
|
Parmotrema tinctorum
|
Punctelia subrudecta NT
|
|
Candelaria concolor N
|
Leptogium cyanescens CS
|
Phaeophyscia adiostola
|
Pyxine caesiopruinosa
|
|
Canoparmelia caroliniana
|
Myelochroa aurulenta
|
Phaeophyscia orbicularis N
|
Pyxine sorediata
|
|
Cetrelia olivetorum S
|
Myelochroa galbina
|
Phaeophyscia pusilloides
|
Rimelia reticulata
|
|
Coccocarpia palmicola CS
|
Parmelia squarrosa S
|
Phaeophyscia rubropulchra N
|
Tuckermannopsis ciliaris AS
|
|
Collema furfuraceum CS
|
Parmelia sulcata NT
|
Phaeophyscia squarrosa
|
Usnea ceratina AS
|
|
Dirinaria aegialita
|
Parmelinopsis horrescens
|
Physcia aipolia N
|
Usnea strigosa A
|
|
Flavoparmelia caperata N
|
Parmelinopsis minarum
|
Physcia americana
|
Usnea sp. AS
|
|
Flavopunctelia flaventior N
|
Parmotrema dilatatum
|
Physcia millegrana NT
|
Athelia arachnoidea para
|
|
Flavopunctelia soredica
|
Parmotrema hypotropum T
|
Physcia stellaris
|
Marchandiomyces corallinus para
|
|
Heterodermia obscurata
|
Parmotrema michauxianum
|
Physconia detersa
|
Nectriopsis parmeliae para
|
Elemental results
Concentrations
of sulfur and metals were measured in the test lichen Flavoparmelia caperata,
collected from each of the 102 plots. Data collected in 2004 are for seven of
the participating park units (Table 3). Data from HAFE and MANA were
collected in 2006. Results from resampling selected plots in 2009 are also provided.
- Element
concentrations varied little throughout the study area and no
significant 'hot spots' were detectable in the individual plot results.
- Data from the
initial (2004/2006) sampling indicated that lichens from PRWI plots had
significantly lower mean concentrations of sulfur, Pb and Cu. This trend
continued in the resampled sites in 2009.
- No
significant differences in mean concentration of Hg or Zn were observed
throughout the study area.
- Concentrations
of Cd and Cr were either very low or below detectable limits.
Table 3. Summary of element
concentrations (µg/g ± S.D.) measured in Flavoparmelia caperata for 2004 (top
values, clear) and 2009 (lower values, shaded). For HAFE and MANA, first
samples were collected in 2006. A link to the complete element dataset is
available for each entry. NR = not resolvable.
|
|
S
|
Pb
|
Hg
|
Cu
|
Ni
|
Zn
|
Cd
|
Cr
|
|
CATO (25 plots)
|
1611.9 ± 18.7
|
22.82 ± 0.89
|
0.14 ± 0.01
|
14.11 ± 0.68
|
NR
|
45.42 ± 1.28
|
NR
|
NR
|
|
1640.94 ± 99.05
|
17.07 ± 2.94
|
—
|
14.79 ± 2.12
|
2.71 ± 0.89
|
52.50 ± 7.69
|
NR
|
NR
|
|
CHOH (10 plots)
|
1585.5 ± 56.3
|
21.93 ± 1.53
|
0.14 ± 0.00
|
18.47 ± 1.37
|
2.72 ± 0.23
|
51.99 ± 2.61
|
NR
|
2.16 ± 1.45
|
|
1691.69 ± 122.50
|
28.03 ± 22.30
|
—
|
16.43 ± 4.70
|
2.87 ± 0.83
|
49.46 ± 12.11
|
NR
|
NR
|
|
GWMP (5 plots)
|
1700.3 ± 54.4
|
28.54 ± 1.83
|
0.15 ± 0.01
|
22.97 ± 3.39
|
3.10 ± 0.41
|
54.28 ± 4.54
|
NR
|
1.99 ± 1.25
|
|
1762.90 ± 52.47
|
20.07 ± 3.80
|
—
|
13.84 ± 1.08
|
2.69 ± 0.39
|
47.65 ± 4.14
|
NR
|
NR
|
|
HAFE (5 plots)
|
1839.81 ± 104.33
|
11.26 ±2.73
|
—
|
11.22 ± 3.29
|
2.10 ± 0.76
|
49.74 ± 4.84
|
NR
|
NR
|
|
1849.16 ± 85.37
|
9.98 ± 3.58
|
—
|
13.01 ± 4.52
|
2.37 ± 1.22
|
48.71 ± 11.37
|
NR
|
NR
|
|
MANA (4 plots)
|
1703.01 ± 236.07
|
8.04 ± 3.99
|
—
|
13.54 ± 4.82
|
2.28 ± 0.61
|
36.94 ± 10.57
|
NR
|
NR
|
|
1542.44 ± 76.27
|
5.66 ± 3.35
|
—
|
9.95 ± 0.81
|
1.36 ± 0.20
|
33.81 ± 4.10
|
NR
|
NR
|
|
NACE (5 plots)
|
1570.3 ± 80.7
|
23.76 ± 2.89
|
0.15 ± 0.01
|
14.15 ± 1.82
|
2.27 ± 0.41
|
40.21 ± 3.84
|
NR
|
NR
|
|
1707.27 ± 143.84
|
18.75 ± 2.59
|
—
|
14.47 ± 1.90
|
2.88 ± 0.52
|
49.13 ± 7.94
|
NR
|
NR
|
|
NAMA
(1 plot)
|
1626.2 ± 199.3
|
40.63 ± 3.53
|
0.12 ± 0.02
|
24.68 ± 19.3
|
4.53 ± 1.69
|
63.88 ± 5.62
|
< 0.54
|
3.10 ± 1.55
|
|
1790.95 ± 17.93
|
47.26 ± 40.16
|
—
|
18.95 ± 7.35
|
2.86 ± 0.01
|
59.46 ± 20.12
|
NR
|
NR
|
|
PRWI (44 plots)
|
1320.5 ± 14.2
|
12.28 ± 0.61
|
0.13 ± 0.01
|
11.37 ± 0.51
|
NR
|
38.97 ± 1.54
|
NR
|
NR
|
|
1471.82 ± 97.13
|
11.53 ± 6.46
|
—
|
13.75 ± 5.75
|
2.30 ± 0.97
|
41.14 ± 8.38
|
NR
|
NR
|
|
ROCR (3 plots)
|
1503.3 ± 58.2
|
23.36 ± 1.58
|
0.13 ± 0.01
|
20.57 ± 4.41
|
2.19 ± 0.14
|
40.91 ± 0.65
|
NR
|
NR
|
|
1686.66 ± 76.77
|
18.03 ± 2.73
|
—
|
14.63 ± 0.93
|
2.71 ± 0.16
|
52.27 ± 4.70
|
NR
|
2.66 ± 0.56
|
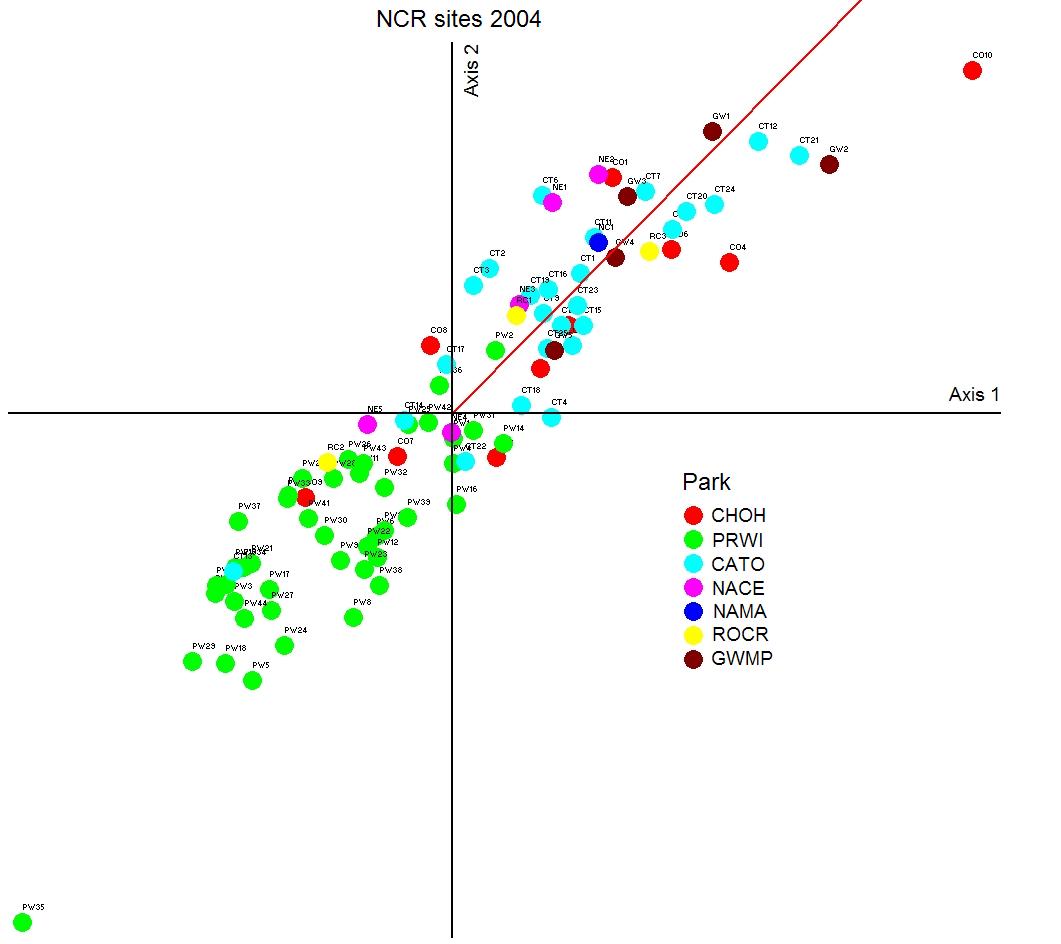
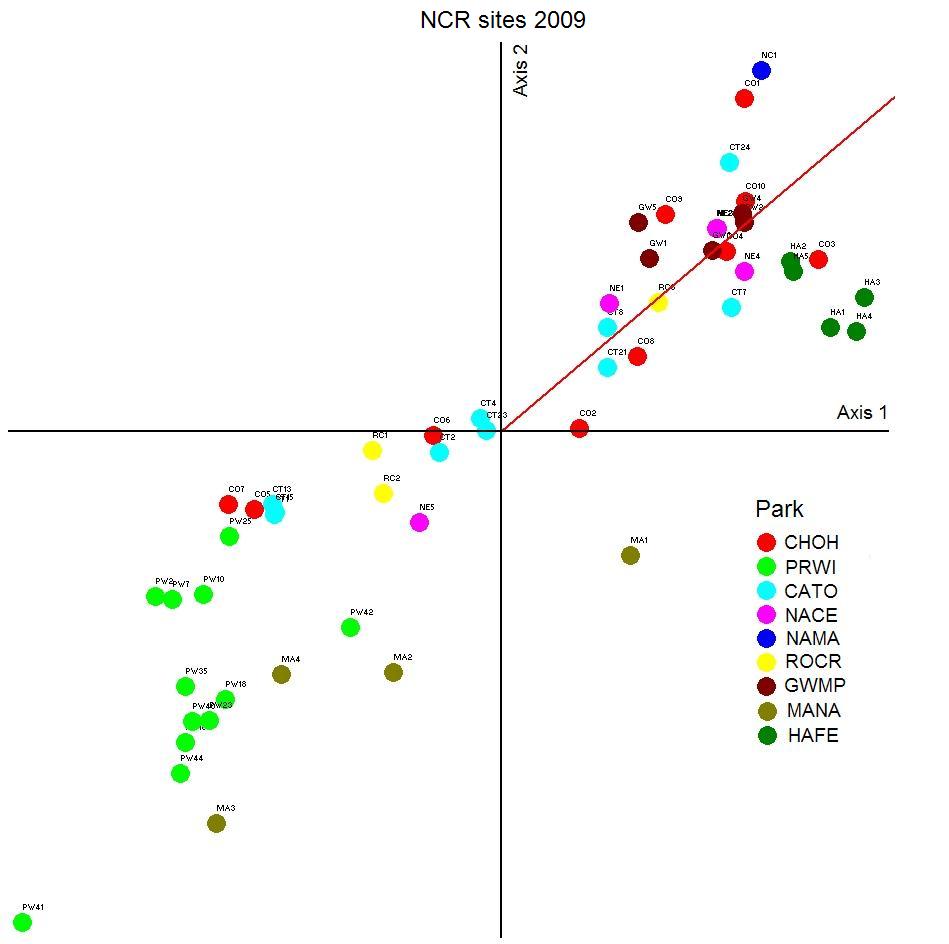
Ordination of sites based on elemental data
Nonmetric multidimensional scaling revealed significant
patterns in both the 2004 and 2009 elemental datasets (Figure 2). Based on
these analyses PRWI plots were clustered separately from the others, a result
consistent with the summary data shown in Table 3. Increasing concentrations
of elements on the ordination axes can be visualized with reference to the S
concentrations (red line on the ordination), which are significantly
correlated with the axes as shown.
Figure
2. NMS ordination of lichen elemental data obtained at each of the plots
established in the NCR for which element data were collected in 2004 (left)
and 2009 (right). For reference, the red lines indicate the specific
correlation of S concentration with the axes in each ordination.
Integrating
floristic and element results with literature results
- Taken
together, the floristic and element data suggest that nitrophilous,
relatively pollution-tolerant lichen communities have developed over
time in the NCR, probably the result of poor air quality in the past and
only slight improvement since.
- Results are
consistent with those of a recent study (McCune et al. 1997) that
analyzed lichen community patterns throughout the southeastern U.S.
as a part of the Forest Health Monitoring Program. The authors found
two major gradients in the data, a macroclimatic gradient from the
coast to the Appalachian Mountains
primarily related to temperature, and another correlated with reduced
air quality caused by nitrogen- and sulfur-based acidifying and
fertilizing pollutants. Dominant lichens were similar to those observed
in the present study (Punctelia rudecta, Flavoparmelia caperata, Usnea
strigosa, Rimelia reticulata, Parmotrema hypotropum, Hypotrachyna
livida, Parmelinopsis minarum, Phaeophyscia rubropulchra).
- There are
few comprehensive studies of eastcoast lichen communities, but those
that are available (e.g., Lawrey 1993 for Monongahela National Forest, West Virginia and Flenniken 2003 for Rhode Island)
report similar floristic results.
- Elemental
concentrations are generally low for Flavoparmelia caperata. Comparison
of 2004 samples with samples collected in the past (e.g., values from Plummers
Island
lichens date from the 1930's) show significantly lower levels of sulfur
and metals in 2004, suggesting an improvement in air quality over time.
- Comparative studies
of U.S.
lichen element status indicate that presentday concentrations of S and
metals in NCR samples of F. caperata are not unusually elevated.
- Chromium
concentrations in the NCR are generally less than 3
µg/g, which is low compared to values measured in other studies.
- Schutte
(1977) found consistently high concentrations of Cr in F. caperata in Ohio.
Lichens from industrialized areas exhibited values exceding 20 µg/g,
up to a maximum concentration of 69.5 µg/g. Lichens from rural areas
had values less than 10 µg/g, but seldom as low as 3 µg/g.
- In 2004
sulfur concentrations in the NCR samples of F. caperata average 1500
µg/g and are always less than 2000 µg/g.
- At Plummers
Island
(see CHOH09
site), S content in F. baltimorensis has declined steadily since
1983 when the concentration was 2500 µg/g. In 2004, the concentration
was 1660 µg/g.
- At Whitetop Mountain in southwest Virginia,
Kinsman (1990) found an average S concentration of 1500 µg/g for F.
caperata, with values generally less than 2000 µg/g at all elevations
and azimuths.
- A study in
Shenandoah
National Park
found that S concentrations in F. caperata and F. baltimorensis were
generally less than 2000 µg/g except in rare cases (Lawrey 1985).
Sites where both species had elevated concentrations were always in
the Northern District of the Park. High concentrations of S are also
generally found at higher elevations in SHEN (Lawrey and Hale 1988).
- In
Monongahela National Forest, West Virginia, mean S values in F.
caperata were 1450 µg/g at Otter Creek Wilderness and 1570 µg/g at
Dolly Sods Wilderness in 1992 (Lawrey 1993).
- Pb values
in 2004 samples are generally low (consistently less than 50 µg/g)
throughout the NCR. Lichens collected at Plummers Island
(see CHOH09
site) for the past 100 years document dramatic increases in
atmospheric Pb deposition prior to the early 1980's. At this time,
leaded gasoline use was phased out in the U.S. and Pb concentrations
in lichens began to sharply decline. This trend has continued to the
present.
- Hg levels
in lichens are generally moderate (average 0.15 µg/g) and probably
reflect background levels for the eastern U.S. However, there are few
comparative data available. No obvious hot spots were detected.
- A study in
southwestern Pennsylvania (Davis et
al. 2002) of Hg uptake by the lichen Punctelia rudecta showed
concentrations of Hg ranging from 0.15 - 0.20 µg/g.
- Higher Hg
levels were measured for the lichen Letharia vulpina in Yellowstone
National Park
(up to 0.243 µg/g, average 0.11 µg/g), probably a result of geyser
emissions (Bennett and Wetmore 1999).
|